15 July 2009
Overview

The Institute of Finance Case Research (IFCR) is an academic organization committed to the production and promotion of case research and instructional techniques in all areas of finance.
The Spring 2009 edition of the Journal of Instructional Techniques in Finance (JITF) presents a case study about how the MikesBikes Simulation is used by Quinnipiac University to aid teaching of Capital Structure and Dividend Policy in an Intro to Business Course.
At the undergraduate level, capital structure and dividend policy are generally introduced in a basic finance class and further developed in advanced courses in corporate finance. Exposure to the concept of shareholder wealth maximization earlier in the curriculum would be beneficial for student understanding of business decision-making. It is difficult to grasp the complexities of the process without some basic appreciation of the financing aspect of those business decisions. This paper outlines a pedagogical method for incorporating capital structure and dividend policy decisions into an Introduction to Business course through the use of a business simulation.
FINANCE IN BUSINESS SIMULATIONS
Educators are being challenged with applying new pedagogical approaches that satisfy the needs of the next generation of students who have grown up with immersive, computer mediated experiences (Lynch and Tunstall 2008; Nadolski et al. 2008). A growing body of evidence suggests that well-designed and relevant simulations can help students learn complex materials relatively easier (Lynch and Tunstall 2008). Recognizing the ability of computer simulations to serve as effective learning tools for complex material and also the fact that students in this generation feel comfortable utilizing immersive computer related tools, this paper examines the use of a business simulation tool to teach complex materials in an undergraduate curriculum.
This paper explores how the complex topics of capital structure and dividend policy can be effectively introduced early in the typical undergraduate curriculum in an Introduction to Business course using a business simulation. It also explores some of the challenges and opportunities facing schools that might decide to adopt the use of business simulations in their undergraduate finance curricula. The paper is organized as follows: we describe the introductory course; we then describe the simulation; we next describe the capital structure and dividend policy decision-making strategies required; finally, we conclude with a summary and discussion of challenges and opportunities.
THE INTRODUCTION TO BUSINESS COURSE
At Quinnipiac University all incoming freshmen and new business majors are required to take a sequence of courses in their first semester that includes Introduction to Business. The Introduction to Business (SB101) course along with Introduction to Information Technology (ISM101) and Personal Effectiveness (SB111) make up the first semester core business sequence. The students take this sequence of three courses as a cohort with projects and assignments that are interrelated across courses. SB101 is taught by a cadre of four to five tenure-track professors with representation from the management, marketing, accounting, and finance departments. The course objectives include exposing the students to the four primary functional areas of business (operations management, marketing, accounting, and finance), emphasizing the interdependency of the functional areas, and developing basic skills required by business students (team-building, leadership, decision-making, business writing, and presentation delivery). While each professor teaches the entire course to their assigned sections, weekly team meetings among the cadre ensure that the respective subject matter expert emphasizes the key goals and objectives for the upcoming topics.
The interdisciplinary course is structured around a computer business simulation called MikesBikes Intro® created by SmartSims Inc. The integrated business simulation ensures that students are forced to apply textbook concepts in an experiential learning exercise shortly after those topics are discussed in class. The sequence of topics is presented in Table 1 with the topic followed by the functional area designated as the subject matter expert responsible for the content of each.
Table 1. Topics and Responsibility.
Topic
Teamwork and Team-Building
Planning, Organizing, Leading and Controlling
Financial Statements
Market Segmentation
Branding
Demand Forecasting
Production and Inventory Management
Promotion Strategies
Pricing
Ratio Analysis
Capacity Planning
Debt Capital
Equity Capital
Dividend Policy
Responsibility
Management
Management
Accounting
Marketing
Marketing
Marketing
Management
Marketing
Marketing
Accounting/Finance
Management
Finance
Finance
Finance
A comprehensive survey of literature related to the use of business simulations in courses is Faria (2001). As Faria notes, research has shown that team member personality traits are a major factor in performance in business simulations (Armenakis, Field, & Holley, 1974; Johnson & Landon, 1974; Napier, 1974). Early in the course as part of the teamwork and teambuilding topic, the students complete a modified version of the Herrmann Brain Dominance exercise (Herrmann, 1981) and are divided into seven teams of four to six students. The size of the teams is determined by the size of the section with the constraint that the simulation allows a maximum of seven teams per class. The goal is that each team has at least one student from each of the personality trait groups. For many students, this is their first experience in a team-related educational project.
As a result, the freshman business program emphasizes interpersonal behavior and group dynamics through workshops and course material. These teams work together throughout the SB101 course and the other two courses in the freshman business sequence. Competition within the business simulation is the primary activity for these student teams throughout the semester.
THE SIMULATION
The course is structured so that the topics covered are immediately followed by an application of the concept through a decision- making challenge in the business simulation. The course relies on a custom textbook where the topics are arranged in the order of the required decisions within the simulation. This approach allows the students to immediately relate the concepts covered in the course to actions required to run the company within the simulation.
The MikesBikes Intro® business simulation package allows the student teams to compete among the seven teams within each section. The number of sections (known as “worlds” within the simulation) ranges from twelve to fifteen depending on enrollment levels in the course. Each world contains seven bicycle manufacturing companies in a multi-period simulation. The simulation begins with all seven teams having identical companies and an identical mountain bike product to “sell.” The teams must initially make very basic decisions such as naming their company and devising a promotion strategy for their existing product. With each subsequent period the decisions become increasingly complex and numerous. The exercise culminates with the launch of a new product (either a highpriced road bike, a redesigned mountain bike, or a low-priced youth bike). By the fourth fiscal year in the simulation each team must make a full set of corporate decisions that include promotion expenditures, product selection, product specifications, production quantity, production capacity, plant efficiency and quality, capital structure, and dividend policy. The number of periods can vary but we elect to end after the seventh “rollover” (eight fiscal years).
The winner of the simulation contest is that team with the highest shareholder value. Shareholder value is calculated through a proprietary algorithm developed by SmartSims Inc. described in Equation 1:
SHV = f(EPS, D/E, DIV)
The variables in Equation 1 are defined as follows:
- SHV is shareholder value defined as market share price plus cumulative dividend payments
- EPS is earnings per share defined as net income divided by shares outstanding
- D/E is the debt to equity ratio defined as book value of debt divided by book value of equity
- DIV is the dividend payment history of the company.
CAPITAL STRUCTURE AND DIVIDEND POLICY DECISIONS
In the MikesBikes Intro® simulation, the student teams launch a new product in the fourth period. During the third period, students must determine whether the company has adequate plant capacity to produce the new product. In addition to the capacity decision, there are significant product development, quality improvement, and promotion strategy costs that are also associated with the new product launch.
At this stage of the course and at this point in the simulation, we introduce the concepts of capital structure. In accordance with the Pecking Order Hypothesis (Myers 1984), the simulation algorithm rewards those student teams that are able to finance their new product launch with internally generated funds. Very few teams are capable of financing the new product launch without raising external capital. The basic tradeoff the teams must make is a comparison of the cost of expanding capacity to launch a new product versus the opportunity cost of lost sales and unsatisfied demand. The nature of the shareholder value algorithm forces the students to thoroughly consider the pros and cons of debt and equity financing and assess the impact of each on the resulting share price.
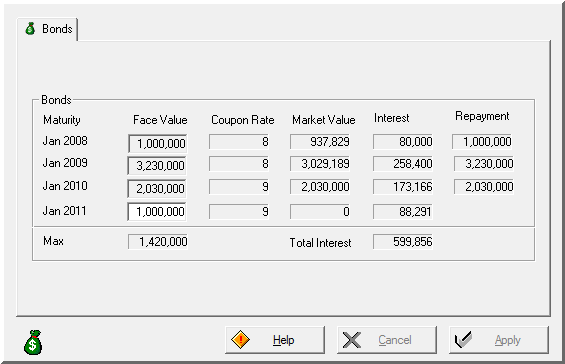
The first option available to the students is debt. Debt financing is available in the short-term (through an overdraft facility that must be paid back in one year at approximately 20% interest) or in the longer-term (through a three-year maturity bond with an 8% annual coupon rate). The student teams are limited in the amount of debt capital they are able to raise based on the financial condition of the company and a maximum amount available on the decision screen. The bond decision screen can be seen in Exhibit 1:
Exhibit 1. The Debt Capital Decision Screen
As the company takes on additional debt and the debt-to-equity level increases, the students will see an immediate negative impact on the share price within the simulation. Also, as the company’s financial condition changes, the required rate of return on debt changes as well and bonds will sell at a premium or discount. For example, the bonds in Exhibit 1 are selling at a discount indicating that the firm’s cost of debt has increased from 8% since the bonds were issued. This is likely due to the increased riskiness the simulation applies to a firm with the relatively high debt level illustrated in the example.
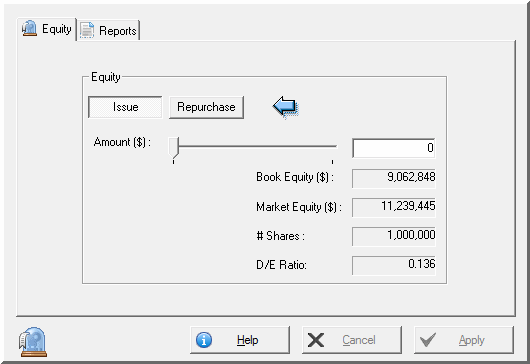
In the period after debt financing becomes available, the students are given the option of raising equity capital within the simulation. The student teams are also limited in the amount of equity capital they are able to raise based on the financial condition of the company. The decision screen for equity allows for equity issuance, share repurchase, and dividend payments and can be seen in Exhibit 2:
Exhibit 2. The Equity Capital Decision Screen
Companies may issue up to 50% of the market value of existing equity during any period but may repurchase only 10% in each decision period (called a “rollover” in the simulation). Further, stock is issued at a 5% discount to current share price (representing flotation costs and market reactions to equity issuance) and equity is repurchased at a 5% premium to current share price. Raising capital through an equity sale has a positive effect on the shareholder value through lowering firm’s debt-toequity ratio, but a negative effect on the shareholder value through lowering earnings per share (as the number of shares outstanding increases). These effects partially offset each other, but the overall impact on share price to an equity issue is generally negative. The other option available on the equity decision screen seen in Exhibit 2 is the ability to pay a dividend. The simulation limits the amount of dividends that can be paid to 50% of the firm’s retained earnings. The fact that dividends have a positive effect on share value tends to support the Gordon (1963) or Lintner (1962) proposition that dividend payments increase firm value as opposed to the dividend irrelevance theory of Modigliani and Miller (1961). Generally, teams only issue a dividend when there is no other more productive use of the cash.
The choice between debt and equity for external financing affords the opportunity to explore several additional capital structure considerations. Perhaps the most important distinction between the two sources of capital that is made obvious to the student is the discretionary nature of dividend payments on stock compared to interest payment obligations incurred with a bond issue. Next, interest payments are a taxdeductible expense in the simulation while dividends are paid from after-tax profits. Finally, students observe the impact of leverage and cost of capital through analysis of the financing decisions within the simulation.
Once the new product is launched, students will have three additional periods to refine their strategy and compete for the highest shareholder value. Teams can (and do) go bankrupt if they have an unsuccessful product launch or make serious errors, but the instructor has the option of providing an “emergency equity injection” to allow every team the opportunity to complete the game. For the successful teams, financial strategies become as critical as product marketing and capacity/ inventory management strategies to winning the game. Indeed professors teaching the course observe that teams often overemphasize the importance financial strategies designed to improve shareholder value at the expense of other value-creating operational decisions.
Within each world, the teams with adequate cash spend the last three periods making decisions that are intended to drive the share price as high as possible. For many teams, this will involve launching additional new products, improving existing products, potentially selling off excess capacity (at a 50% discount), and implementation of cost control measures. Further, many teams will use available cash to repurchase shares, pay off outstanding debt, and pay dividends in an effort to increase earnings per share, reduce the debt-to-equity ratio, and increase cumulative dividends paid. MikesBikes Intro® has restrictions on the capital structure and dividend decisions to avoid teams being able to “game the system” at the end of the simulation. Recall the 5% premium on repurchased shares, and restriction that teams may not buy more than 10% of the outstanding shares in any one period. Once the maximum number of shares has been repurchased (and earnings concentrated as much as possible), the amount of excess cash that can be paid out as dividends is limited to 50% of the value of retained earnings account from the balance sheet. The winning team is typically a team that had a successful product launch, excellent demand forecasting ability, and a thorough understanding of capacity planning and inventory management. Further, the winning teams always employ at least one, if not all, of the capital structure and dividend policy strategies described above.
CONCLUSION
In the seven years that Quinnipiac University has used the MikesBikes Intro® simulation package as part of the Introduction to Business course, we have found it to be an effective way to introduce many complex business topics that are often not fully understood by the students until much later in their undergraduate curriculum. In this paper we have focused on the key financial considerations of capital structure and dividend policy. The students are introduced to the concepts as a topic in Introduction to Business and the concepts are reinforced during the later Corporate Financial Management course. For finance majors, the topic is explored yet again in the required Intermediate Corporate Finance course. At the end of the course, the professors in the course conduct a survey of the students. One of the questions seeks to gauge the student perception of understanding in each of the functional areas of business. The survey asks the following question: “Indicate how much you feel you learned about each of the functional areas of business through the simulation.” The responses are on a 5-point scale with 5 being the highest (“A Great Deal”) and 1 being the lowest (“Nothing”). The results of this survey question are presented in Table 2.
The survey indicates that almost 90% of the students in the course feel that they learned some or a great deal about finance through the use of the simulation. A similar question asks them to rate their perceptions on learning with respect to specific learning goals. The survey asks the following question: “Using the rating scale below, indicate how well you feel you learned the concepts through the simulation.” Again, the responses are on a 5-point scale with 5 being the highest (“Learned Very Well”) and 1 being the lowest (“Didn’t Learn at All”). The results of this survey question are presented in Table 3.
For purposes of this study, we focus primarily on the dividend policy and debt/equity financing concepts where the vast majority of students (approximately 85% of respondents) feel they learned the concepts in either the “learned a great deal” or “learned somewhat” categories. While student perceptions of learning are often biased, we interpret these results to mean that the students generally view the simulation as a valuable part of the course and useful learning experience.
The use of the simulation to introduce the capital structure and dividend policy concepts does present challenges. First, a student could possibly learn to correctly change the numbers in the decision screen within the simulation with little to no understanding of the underlying concept behind the impact on shareholder value. Indeed, many of the students that perform best in the simulation are not the same students that perform best in the course. Student grades are determined by exam scores, assignment grades, and a course project that requires synthesis of the course content with simulation outcomes. Another major concern is that students equate success in the simulation with earnings manipulation and accounting “shell games.” In this era of rampant accounting fraud, an academic exercise that rewards potentially questionable financial decision-making is a serious concern. Finally, the nature of the team decision-making does little to ensure that every student on each team fully understands the application of the concept. Often, one or two students on a team make a majority of the decisions and “free riders” are allowed to coast along. We attempt to mitigate this situation by weighting the course project grade by a peer evaluation grade, but invariably some team members “slip through the cracks.” Unfortunately, it is impractical to run the simulation with companies run by individual students. However, every student in the course takes a common final exam specifically designed around the MikesBikes Intro® simulation. This evaluation helps ensure that all students are knowledgeable in the concepts developed during the exercise.
Overall, the MikesBikes Intro® simulation is perceived by students and faculty alike as a positive experience for the new business students. First and foremost, it exposes the students to the different functional areas of business within a company, shows how decisions within those functional areas are interrelated, and demonstrates the importance of each for a successfully managed company. For finance in particular, the positives far outweigh the negatives. Even for students that may not fully grasp the concept during the Introduction to Business course, instructors in upper-level finance courses are frequently able to refer back to the shared MikesBikes Intro ® experiences when these topics are revisited later in the curriculum. Instilling the concept that maximizing shareholder value leads to success in business at an early stage of the curriculum establishes a solid foundation for students in the finance major. Understanding by beginning business students of the impact of capital structure and dividend policy on shareholder value, even at a very basic level, makes the simulation worth consideration for inclusion in an undergraduate business curriculum.
Table 2: Survey Results – Functional Areas of Business
|
A Great Deal |
Some |
A Little |
Very Little |
Nothing |
Rating Average |
Response Count |
| Management |
152 |
210 |
30 |
9 |
1 |
4.25 |
402 |
| Accounting |
110 |
203 |
64 |
22 |
4 |
3.98 |
403 |
| Marketing |
209 |
164 |
22 |
7 |
1 |
4.42 |
403 |
| Finance |
180 |
181 |
31 |
8 |
2 |
4.32 |
402 |
| answered question |
|
|
|
|
|
403 |
403 |
| skipped question |
|
|
|
|
|
15 |
15 |
Table 3: Survey Results – Specific Business Concepts
|
Learned very well |
Learned Somewhat |
Neutral |
Didn’t Learn Much |
Didn’t Learn at All |
Rating Average |
Response Count |
| Integration of functional areas |
133 |
207 |
55 |
6 |
1 |
4.16 |
402 |
| Industry analysis |
154 |
203 |
42 |
2 |
1 |
4.26 |
402 |
| Competitive Advantage |
204 |
164 |
30 |
2 |
1 |
4.42 |
401 |
| Competitor Analysis |
189 |
169 |
40 |
4 |
1 |
4.34 |
403 |
| Creating an effective mission statement |
147 |
179 |
62 |
8 |
5 |
4.13 |
401 |
| Analyzing and using financial data |
186 |
173 |
38 |
2 |
1 |
4.35 |
400 |
| Forecasting demand |
194 |
163 |
34 |
9 |
2 |
4.34 |
402 |
| Capacity Planning |
187 |
165 |
40 |
7 |
2 |
4.32 |
401 |
| Debt versus equity for financing |
197 |
141 |
52 |
8 |
4 |
4.29 |
402 |
| Dividend policy |
174 |
161 |
53 |
11 |
3 |
4.22 |
402 |
| Effective decision making |
225 |
142 |
33 |
1 |
1 |
4.47 |
402 |
| Impact of decisions made on firm outcomes |
221 |
143 |
36 |
1 |
1 |
4.45 |
402 |
| answered question |
|
|
|
|
|
403 |
403 |
| skipped question |
|
|
|
|
|
15 |
15 |
REFERENCES
Armenakis, A., Feild, H., & Holley,W. (1974). Correlates of satisfaction, learning and success in business gaming. Simulations, Games and Experiential Learning Techniques, 1, 272-277.
Faria, A., (2001). The changing nature of business simulation/ gaming research: A brief history. Simulation & Gaming, 32:1, 97-110.
Gordon, M. (1963). Optimal investment and financing policy. Journal of Finance, 18:2, 264-272.
Herrmann, N., (1981). The creative brain. Training and Development Journal, 35:10, 10-16.
Johnson, G.,& Landon, L. (1974). Identifying successful game participants. Simulations, Games and Experiential Learning Techniques, 1, 295-299.
Lintner, J. (1962). Dividends, earnings, leverage, stock prices, and the supply of capital to corporations. Review of Economics and Statistics, 44:3, 243-269.
Lynch, M., and R. Tunstall (2008). When worlds collide: Developing game-design partnerships in universities. Simulation & Gaming , 39:3, 379-398.
Miller, M. and F. Modigliani (1961). Dividend policy, growth, and the valuation of shares. Journal of Finance, 34:4, 411- 433.
Myers, S., (1984). The capital structure puzzle. Journal of Finance, 39:3, 575-592.
Nadolski, R.J., Hummel, H.G.K., van den Brink H.J., Hoefakker R.E., Slootmaker A., Kurvers H.J., and Storm., J (2008). EMERGO: A methodology and toolkit for developing serious games in higher education, Simulation & Gaming, 39:3, 338-352.
Nadolski, R.J., Hummel, H.G.K., van den Brink H.J., Hoefakker R.E., Slootmaker A., Kurvers H.J., and Storm., J (2008). EMERGO: A methodology and toolkit for developing serious games in higher education, Simulation & Gaming, 39:3, 338-352.
Napier, H. (1974). Autocratic vs. democratic decision making. Simulations, Games and Experiential Learning Techniques, 1, 291-294.
Sean Reid (Finance), Len LaBonia (Marketing),Ben Shaw- Ching Liu (Marketing), Patrice Luoma (Management), and Anthony Asare (Marketing) are professors at Quinnipiac University. Together, they team teach the freshman integrated business course described above.
This article has been reproduced in its entirety from the Spring 2009 edition of the Journal of Instructional Techniques in Finance (JITF)
Published by the Institute of Finance Case Research (IFCR)
Mikes Bikes Case Study Article PDF