Student Advice Archives

reduce manufacturing cycle time text in a blackboard

Question of the Week: How do we reduce our Manufacturing Cycle Time?

Manufacturing cycle time in MikesBikes Advanced is the time from when an order is received to the factory to when it leaves the factory (to go to the warehouse). It is often measured in weeks and indicates the responsiveness of the production process.

While simply holding finished goods stocks allow rapid fulfillment of a customer’s order, it requires financing (money tied up in stock). Long manufacturing cycle times mean less responsiveness to changes in demand patterns – e.g. if a new competitive product takes the market share. Hence, reducing manufacturing cycle time is desirable where possible. This will usually mean manufacturing with small batch sizes. However, small batch sizes mean frequent setups. Setup times must be reduced to avoid most of the capacity of the machine being taken up on non-product setup time, rather than working on the product.

To get the best trade-off between responsiveness  and capacity utilization in a fast changing market, investments in just-in-time systems and computer integrated machinery are required.

Other contributors to the length of the cycle times are:

  • Number of products
  • Complexity of products being produced by the firm and;
  • The firm’s factory capacity

A rough rule of thumb is that production cycle time will increase in proportion to increases in batch size, number of products or product complexity. On the other hand, it will decrease in proportion to any increases in factory capacity.

Do you have a question suggestion for our next question of the week? Send us a message.

factors influencing the product specs index

Question of the week: What factors influence the Products Specs Index in the Market Summary Report?

The Product Specs is a statement of how a design is made, what it is intended to do and if it complies with the preferences of each market segment. The ideal product attribute levels desired by each segment and the actual attribute levels for all products on the market are in the Market Segments and Product Attributes Report (go to Design and Development menu ->Reports tab)

The Product Specs Index which you can see in the Market Summary Report on the other hand is based on the distance from the ideal consumer preferences relative to the radius of influence of a segment on the perceptual map.

What does this mean for you?

If, on the perceptual map, a product is at a point which is exactly halfway between the ideal segment center point and the outer ring, then your product spec index will be approximately 0.50. If you are on the outer ring, your index will be closer to 0.01. If you hit close to the center, then it will be closer to 1.0. It does not matter whether you are above or below the ideal point – what matters is your distance away from it relative to the radius of influence for the market segment.

How do you determine what the product specifications are?

The Market Segments and Product Attributes report shows the exact values last period. Go to Reports->Marketing Reports->Product Reports to view this report.
Note that the Perceptual Map chart (which you can find in the Key Reports menu) also show the ideal consumer preferences for last period. The ideal points tend to shift over time in MikesBikes Advanced due to changes in the preferences of the consumers. If you aim for what you currently see on the map, then you are likely to find the segment center points have shifted slightly when you see the results after the rollover.

Do you have a question suggestion for our next question of the week? Click here to fill out a form or email it through to help@smartsims.com.

board with question of the week photo, how do we ensure our factory is operating at its optimum level?

Question of the Week: How do we ensure that our factory is operating at its optimum level?

In MikesBikes, as in real life, your factory is most effective when the capacity of your workers is well matched to the capacity of your plant.

The formula used to calculate your Total Capacity (SCU) is:

Total Capacity (SCU) = √ (Factory Workforce Capacity SCU * Plant Capacity SCU)

This equation allows you to emphasize one form of capacity over another depending on how each approach fits with your strategic plan. For example, you can employ more workers immediately whereas you have to wait 12 months for new plant to become available.

Just be aware that if your Factory Workforce Capacity and Plant Capacity get too far out of balance then together they will not be working to their full potential.

Check your Manufacturing Responsiveness report when deciding whether to hire more or workers or purchase more Plant.

Here are some examples on how to calculate your Total Capacity:

Example 1

Factory Workforce Capacity = 30,000 SCUs and Plant Capacity = 30,000 SCUs

Total Capacity = 30,000 * 30,000 = 30,000 SCUs

Example 2

Factory Workforce Capacity = 40,000 SCUs and Plant Capacity = 15,000 SCUs

Total Capacity = 40,000 * 15,000 = 24,495 SCUs

Example 3

Factory Workforce Capacity= 50,000 SCUs and Plant Capacity = 25,000 SCUs

Total Capacity = 50,000 * 25,000 = 35, 355 SCUs

Do you have a question suggestion for our next question of the week? Click here to fill out a form or email it through to help@smartsims.com.

Photo with bike and article title, top 3 questions student asked

Top 3 MikesBikes Questions Students Ask

 “Don’t be afraid to ask questions. Don’t be afraid to ask for help when you need it. I do that everyday. Asking for help isn’t a sign of weakness, it’s a sign of strength. It shows you have the courage to admit when you don’t know something, and then allows you to learn something new.”

– Barack Obama

Here are the top three questions that students asked from the last two MikesBikes Introduction Q&A sessions we held recently. If you have missed the sessions or would like to review the questions asked, you can view the posts through our Facebook page here.

Question #1

What would you say is the biggest challenge that we will face and how should we deal with it?

The “biggest challenge” differs with each firm, but there are a few common challenges students will face:

  1. Excessive Inventory or Lost Sales

Both of these scenarios are caused by inaccurately forecasting your firm’s sales for the year ahead. Ideally a firm would want to minimize this by correctly forecasting sales and adjusting your production based on this forecast (while also taking into account existing inventory levels).

There is a very helpful video available that demonstrates how to Forecast Sales within MikesBikes Introduction for new and existing products. Click here to view the video.

  1. Not paying attention to consumer preferences.

It is crucial that your Product Strategy follow the preferences of your consumers. Valuable Market Research has been conducted to investigate what your customers are looking for in the products they buy. This information is available to you under the Market Information Report (under the Key Reports menu).

Market Information Report with information on Product Dimension Sensitivities and Preferences in MikesBikes Intro

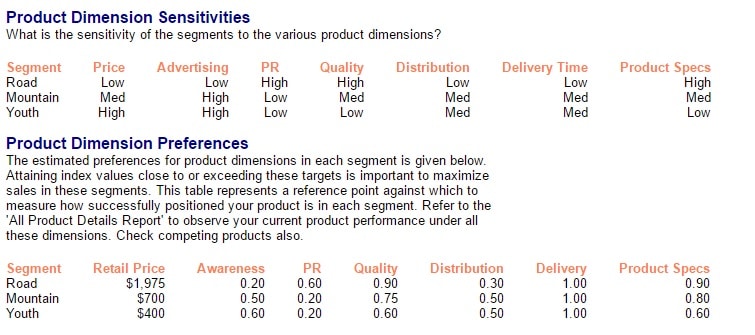
The table above (taken from the Market Information Report) will tell you important areas that you should be focusing on. For example, the Mountain Segment has High sensitivity to Advertising. What this means is you should be focusing your Marketing Budget on Advertising and not PR (as the Mountain segment has low sensitivity in this area). If a market segment is highly sensitive to one area this means: “if you increase this figure, then proportionately more people are going to buy your bike.” This would then result in a higher return on your investment than if you invest in areas where your target market segment has a low sensitivity in.

  1. Incorrect Pricing Strategy

Students make a mistake on pricing their products too high without the increasing demand and their Sales Revenue starts to suffer. Contrary to that, some may also enter into a pricing war and priced their products too low resulting in difficulty covering costs.

When a situation like this arises, you will need to assess where your products are situated in relation to consumer preferences and your competitors. The best report to look at would be the “Market Summary Report” and identify if your product has low Awareness, low Quality or low Delivery (or all of the above) in comparison to your competitors. If they do, you should price your product at the lower end of the market. If not and demand for your product is still average to high, then you can price your products at the higher end of the market. Keep in mind that extreme prices, high or low, will have a negative effect on Gross Margins.

Question #2

In the fourth period, we’ll be given the option to launch a new product and modify our existing product. Is it better to remodel an existing product or launch a new product?

This depends on what your team decides to be more valuable to your strategy.

Essentially, when looking at launching a new product you will need to ask yourself the following questions:

  • How big is the market for this product (Check the Market Information Report)?
  • How many existing competitors are in there?
  • Are we expecting any new entrants into this segment in the upcoming rollover? If so, what do we anticipate their market share would be?
  • How many bikes would we anticipate on selling?
  • Taking into account of the above, how much would we spend on marketing to enter the market?
  • Based on our effective number of sales in the segment, what do we anticipate our profit to be?

You can then compare this potential profit against the potential profit gained from modifying your bike.

In remodeling your existing bike, you will look at things like:

  • Are we remodeling to reduce costs or improve Technical Specifications (or both)?
  • If we want to reduce costs, is the $1 million modification cost outweighed by the profit gained in the reduction costs?

You can calculate it as:

Old Production Costs – New Production Costs x Number of bikes you anticipate you will sell

  • If you want to update the Technical Specifications, look at the Market Information report to see how sensitive the market segment is to changes in that? If it is High, then getting closer to the Ultimate Technical Specifications could result in significant increases in demand for your product (depending on how far away your product is from that desired technical specifications).
  • How do anticipate this impacting our sales?

Once your team has looked at those two things (new bike versus modification) then you can decide, “Okay, which is more valuable to us right now? Can we afford that? Could we afford both? Or neither?” You can then evaluate your Cashflow Report for your Ending Cash Balance from the previous year.

Question #3

What is the best strategy to implement to get the best return in Distribution?

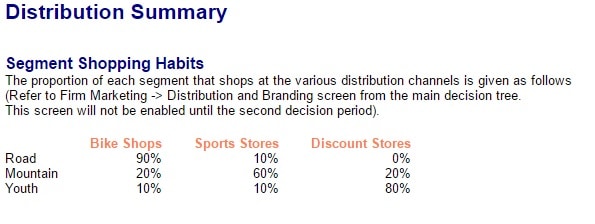
The best strategy is to look at the Distribution Summary report (see the table below for what this might look like) and analyze where your customers shop. Once you have identified this, place more emphasis on your Retailer Margin and Extra Support in those Distribution Channels.

Distribution Summary Report in MikesBikes Intro

It is also important to keep in mind here that the more a distributor profits from selling your products, the more likely they are to stock your product in upcoming years.  That means they consider things like your Price, Sales Volume, Retailer Margin and Extra Support. However, be careful not to eat so much into your own products.

If you have any questions, please feel free to click here and fill out a form or email us at help@smartsims.com.

Picture with text overlaying saying how to forecast sales within MikesBikes Advanced

How to Forecast Sales in MikesBikes Advanced

The video above will demonstrate how to make a Sales Forecast for an existing product and a new product, as well as the complementary production decisions for both.

Just a note that for our example in calculating the Planned Production units for our existing product, you will see that we have Closing Inventory. However, if you have no units of Closing Inventory, you do no need to subtract any units from your Sales Forecast to calculate your Planned Production.

We have provided you with the script for the video below to read through:

“In MikesBikes Advanced you will be required to enter a Planned Production decision for each of your products. Your Planned Production will be your Sales Forecast minus any existing stock.

Planned Production = Sales Forecast – Existing Stock

How do I conduct a Sales Forecast?
A Sales Forecast is a prediction of the number of units we believe we can sell in the year ahead. This is calculated by predicting our market share for the year ahead; being the percentage of the total market we believe we can secure.
Estimated Market Size Next Year x Percentage Market Share

What is our market share?
So what we need to do first is to identify our current market share through the Market Summary report. We can see that for our RC Rockhopper product, we had a market share of 49.8% of the total unit sales last year.

What is the estimated market size next year?
We then need to find out what the total market size will be for the year ahead. If we look at the Market Information report, we can see the forecast demand for the year ahead is 45,000 units.

Calculating our Sales Forecast
Therefore, in this example our Sales Forecast would be 49.8% of 45,000 units. Being 22,410 units.

Note that if you believe that based on your decisions for the year ahead you can increase your market share from last year, you would adjust this figure.

For this example, we believe our market share will remain constant therefore Sales Forecast will be 22,410 units.

Calculating our Planned Production
Now that we have a Sales Forecast we can calculate our Planned Production.

We can see on the Product Summary report that we have 1,698 units of Closing Inventory.

Therefore, our Planned Production is 22,410 minus 1,698 units. Being 20,712 units.

This is entered this into the Products screen under “Pricing”.

How do I conduct a Sales Forecast for a New Product?
For a new product, the challenge is we do not have any existing sales to calculate a Sales Forecast from.

Therefore, a Sales Forecast for a new product can only be based on the Forecast Total Market Size.

In this example, we are wanting to launch into the Leisure market.

The Market Information report tells us that for the year ahead, the Forecast Demand for the year ahead is 26,000 units.

If we then look at the Market Summary report we can see that there were no competitor products in this market last year. However, given the opportunity an empty market creates, we should assume that at least one other competitor will also launch into this market.

Considering this Single-Player scenario only has one other competitor we can aim to produce 50% of the Leisure market’s total size which is 13,000 units. Click Apply”


If you have any questions, please feel free to click here and fill out a form or email us at help@smartsims.com.