
Not understanding this can be a costly mistake as it often leads to incorrectly assigning your Advertising Mix. This can have a negative impact on the demand for your products and can also lead to overspending. Meaning your firm’s profitability is at risk!
How do you know if you are spending your advertising budget inefficiently? Follow through this section, it will show you how to efficiently allocate your advertising budget.
Each market segment is sensitive to different dimensions and you can find this information through the Market Research report.
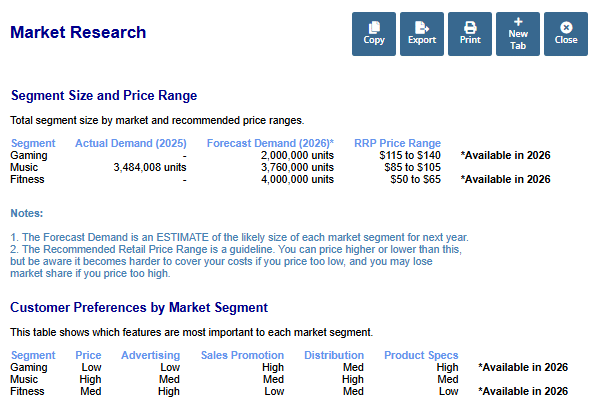
How do I interpret this Product Dimension Sensitivities graph?
The best way to explain it is through an example. If you take the Music segment, you’ll see it has a high sensitivity to Price. This means that an increase to your price (example setting the price to the maximum) is going to have a negative effect on your sales volume.
What these sensitivities mean is a change in any of these factors, will result in a proportionate change in the consumers’ demand for your product(s).
There are five media choices to develop your advertising mix on: Social Media, Digital Media, TV, Print and Radio.
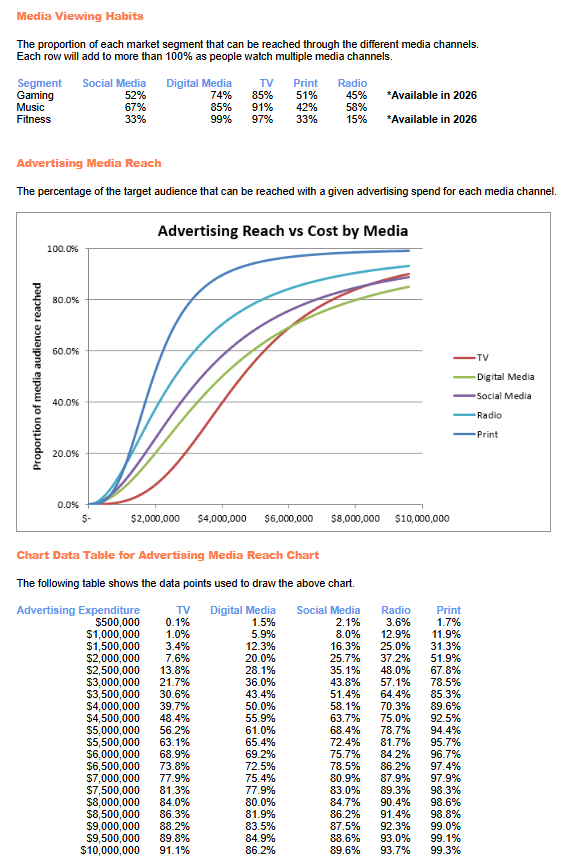
There are two substantial sources of information you can use to determine your optimal advertising mix for a given advertising spend: Advertising Media Reach and Media Viewing Habits. Both information can be found in the Market Information report.
Each media type can reach a given proportion of its audience for a given investment. This is shown within the Advertising Media Reach chart.
The best way to explain this would be to provide an example.
Example: Budget of $4 million on Music Segment.
Option 1: 91% of the Music Segment watch TV.
So our $4 million spend would reach approximately 39.7% (taken from the graph at a spend of $4 million) x 91% (Media Viewing Habits) = 36.13% of the Music segment can be reached
Option 2: 85% of the Music Segment can be reached via Digital Media.
So our $4 million spend would reach approximately 50% (taken from the graph at a spend of $4 million) * 85% (Media Viewing Habits) = 42.5% of the Music segment
Option 3: But maybe we can do better than that still. What happens if we spend $2 million on Digital Media, and $2 million on Social Media?
If we spend $2 million on Radio, we could reach 37.2% of Radio listeners and 58% of the Music segment can be reached through Radio. So we could reach approximately 58% (Media Viewing Habits) x 37.2% (taken from the graph at a spend of $2 million) = 21.58% of the Music Segment.
If we spend $2 million on Print we could reach approximately 51.9% of Print readers and 42% of the Music segment can be reached through Print. So we could reach approximately 42% (Media Viewing Habits) x 51.9% (taken from the graph at a spend of $2 million) = 21.8% of the Music segment.
So, together our $4 million spent half on Radio and half on Print would reach approximately 43.38% of the Music segment, which is obviously a better use of our Advertising budget than the first two options.
As you can see, with the same budget, but a different allocation towards each media channel can make a huge difference in the amount of consumers you can reach.
This is only an example different marketing mixes. This is far from the best mix you can make. We suggest playing around on different Marketing Mix and see what works best for your strategy and budget.