The effectiveness of your advertising budget and allocation (mix) is measured by the awareness of your product in the minds of customers. You can track your Product’s Awareness rating and compare with competitors through the Market Summary report.
Note that Brand Promotion (from Year 2) makes customers aware of your company, and therefore more receptive to your product advertising. This also helps to increase your Product Awareness.
To influence your rating, you should increase your total Advertising expenditure, improve your Advertising mix and invest in Brand Promotion activities.
Advertising Mix
Your Advertising Mix is how your Advertising budget is allocated across the five media channels (Search, Digital Video, Social Media, TV and Print). To improve this, you will need to identify which channels your customers view the most (see Market Research report).
Below are steps on how you can develop an effective Advertising Mix.
How to Develop an Advertising Mix:
There are three substantial resources that you can use to determine your optimal advertising mix for a given advertising spend. One is through the Advertising Reach for Media Channels curve, the Customer Preferences by Market Segment and the Media Viewing Habits table.
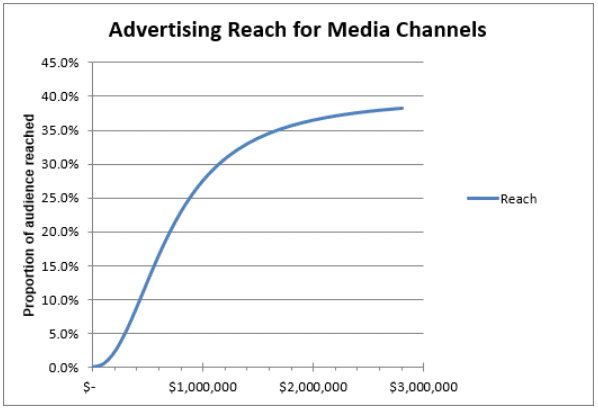
Each media type can reach a given proportion of its audience for a given investment. This is shown within the Advertising for Media Channels graph.
As an example, let’s say we’re developing an Advertising Mix for the Mountain segment with a budget of $2 million.
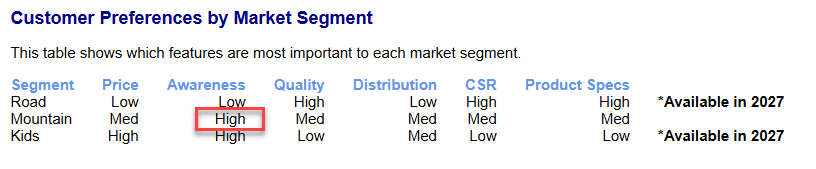
Step 1: Identify the segment’s sensitivities
If we look at the Market Information Report, we will see in the Product Dimension Sensitivities that the Mountain segment has High sensitivity in Awareness.
Step 2: Identify the segment’s Media Viewing Habits
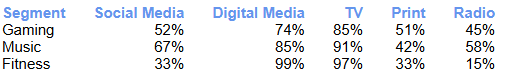
You will need to consider your consumers’ viewing habits by referring to the Media Viewing Habits chart (below) to help you allocate your budget on each channel.
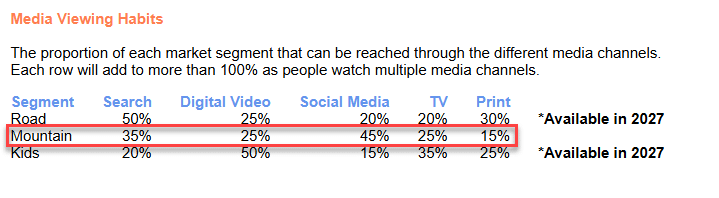
- The table indicates that the majority of the Mountain segment can be reached through Social Media (45%), followed by Search (35%). Digital Video and TV each account for 25%, while Print reaches the smallest portion at 15%. You can then use this information with the reach curves to calculate the percentage of the market segment you’re actually reaching.
Step 3: It’s now time to allocate our Advertising Budget!
We know that we have $2 million to spend on Advertising this Mountain product directly. We also know the following:
- 45% can be reached via Social Media
- 35% can be reached via Search
- 25% can be reached via Digital Video
- 25% can be reached via TV
- 15% can be reached via Print

If we spend $800K, we will reach around 23.0% of our customers. 45% of the Mountain Segment can be reached via Social Media, meaning we could reach approximately:
23.0% x 45% = 10.35% of the Mountain Segment.
If we spend $600K, we will reach around 16.6% of our customers. 35% of the Mountain Segment can be reached via Search, meaning we could reach approximately:
16.6% x 35% = 5.81% of the Mountain Segment
If we spend $200K, we will reach around 2.3% of our customers. 25% of the Mountain Segment can each be reached via Digital Video and TV, meaning we could reach approximately:
2.3% x 25% = 0.58% of the Mountain Segment
If we spend $200K, we will reach around 2.3% of our customers. 15% of the Mountain Segment can be reached via Print, meaning we could reach approximately:
2.3% x 15% = 0.35% of the Mountain Segment
Together, our $2 million budget would reach approximately 17.67% of the Mountain Segment.
This is only an example. This is far from the best mix you can make. We suggest playing around on different Marketing Mixes and see what works best for your strategy, and budget.