
The short answer? Yes! It absolutely does matter. Not only do people listen/watch different media to each other but each media type is engaged in differently.
Think about somebody within your family that is of a dramatically different age from you (maybe a parent or a sibling). Think about their media viewing habits, they are likely to watch more TV than you or spend more time online. If they do watch/listen/read the same media types then they might be more inclined to watch a different TV show, visit different websites, or read different magazines which are targeted to attract their demographic.
Further, think about how people engage in the different media types. Often TV will immerse somebody in the story/show more than a radio station will. You might have someone sitting in front of their television paying complete attention to their show whereas a radio station might only be engaged in while driving where someone’s attention span is split. Compare this to the internet, you are likely to have 15 different Internet Browser tabs open that you insist on not closing because you may one day need them – often not paying complete attention to one website or task. This leads to the question…
“How do I decide which media channel to allocate our budget to?”
Look to the Market Information report within the simulation (you can find this by clicking on ‘Key Reports’ in the left-hand menu then clicking on the drop-down box and selecting ‘Market Information’). Scroll down to Media Channels section which will look like this…
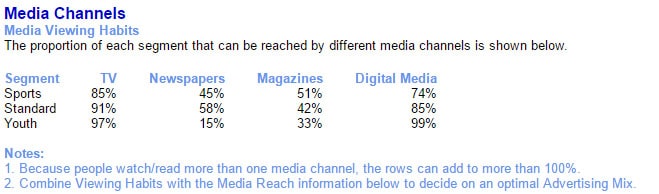
This table shows us that there are three different market segments within Music2Go (which are described within pages 8 – 9 of the player’s manual) and four different media channels. Each media channel reaches a certain % of the segment it correlates to (note that people will often watch more than one channel so the rows will add up to more than 100%).
If we look at the Standard Segment we will see that 91% of this market segment can be reached through TV; 45% of the market segment can be reached through Newspapers; 51% through Magazines; and 74% through Digital Media.
Based off above, if we were marketing our Standard product we might decide to simply push all of our budget into TV and Digital Media but you also need to consider the reach of each media channel. (You can find the media reach of each media channel by scrolling further in the Market Information report).
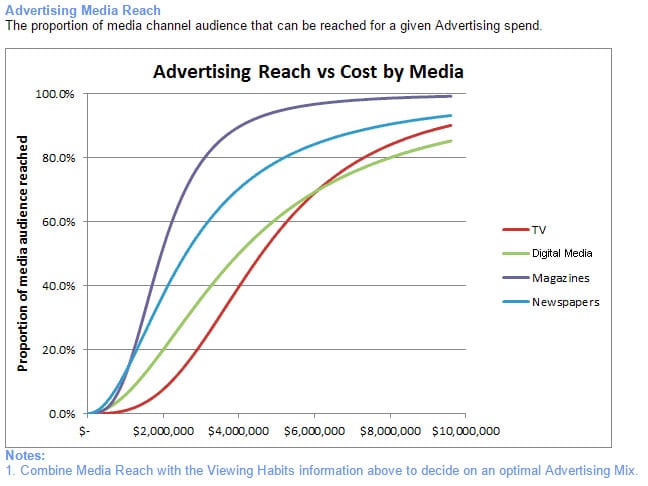
Based off this graph alone we might say that Magazines is the most efficient at reaching the audience per $ spent and TV the most inefficient. However, look at the media viewing habits and you will find the standard segment watches more TV than they read Magazines. While one media channel is more efficient per $ spent, less of the segment reads it; the other is watched by a larger proportion of the segment but is quite expensive. How do you decide?
You need to work out the best marketing mix for your budget. Within the simulation that is easily figured out by looking at what combination of the advertising spend will reach the greatest proportion of your segment reached. This is best explained through an example…
“I have $5 million to spend advertising my Youth product. I want to look at the best media channels to spend this on to reach the most people who might buy our product”
Looking to the media viewing habits table I see that:
97% are reached through TV. 15% through Newspaper. 33% through Magazines 99% through Digital Media.
I am considering three options:
Option one:
$3,000,000 spent on TV and $2,000,000 spent on Digital Media
$3,000,000 on TV will reach 21.7% of the TV audience and 97% of people within the Youth market watch TV.
$2,000,000 on Digital Media will reach 20% of the Digital Media audience and 99% of people within the Youth market use Digital Media.
Potential proportion of Youth Segment reached:
(21.7% x 97%) + (20% x 99%) = 40.85%
Option two:
$3,500,000 spent on Magazines and $1,500,000 spent on Digital Media
$3,500,000 on Magazines will reach 85.3% of the Magazines audience and 33% of the Youth segment read magazines.
$1,500,000 on Digital Media will reach 12.3% of the market and 99% of the Youth segment can be reached through Digital Media.
Potential proportion of Youth Segment reached:
(85.3% x 33%) + (12.3% x 99%) = 40.33%
Option three:
$1,500,000 on TV, $1,500,000 on Digital Media, and $2,000,000 on Magazines
$1,500,000 spent on TV reaches 3.4% of the TV audience and 97% of people within the Youth market segment.
$1,500,000 spent on Digital Media reaches 12.3% of the Digital Media audience and 99% of people within the Youth market segment.
$2,000,000 spent on Magazines reaches 51.9% of the Magazine audience and 33% of the Youth market segment.
Potential proportion of Youth Segment reached:
(3.4% x 97%) + (12.3% x 99%) + (51.9% x 33%) = 32.6%
While only half a percent difference between options one and two, I will choose option one because it has the potential to increase the awareness of my products more and convince my audience to purchase my product. (Note: The above examples is not the optimal spend for this spend, you will need to calculate what is appropriate for your situation). Be sure to regularly check how effective your marketing budget is through the ‘Product Awareness Increase By Media’ report to see how effective your advertising mix is.
If you follow similar steps you can use this method for calculating how to effectively allocate your marketing budget into Advertising (be sure to check whether or not a large spend is worthwhile by reviewing the market segment sensitivities to advertising).
Should you have any questions about the simulation feel free to get in touch with us at help@smartsims.com or fill out a contact us form.