In Year 1 of the AdSim Advertising Simulation you will need to develop an Advertising Plan. This will involve you setting a total budget, and then allocating this across five advertising platforms:
Social Media
Social media platforms enable users to connect and share their stories with others.
These platforms provide companies with the ability to integrate paid advertisements
within the user’s news feed. Specific audience targeting can be achieved through user
interests. Examples: Facebook, Instagram, Twitter.
Digital Media
Advertising through Digital Media allows you to engage and reach potential customers
through their devices. Methods such as paid advertising on search platforms, digital
video and music streaming services. Examples: Google Ads, Youtube, Spotify.
Television
Television advertising on cable and free-to-air broadcasts is still one of the most
effective methods of reaching a large audience. Live viewers do not have the ability to skip advertisements, so your promotional content is seen by the majority of the viewing audience.
Print advertising covers promotional content featured in magazines, newspapers,
direct mail and out of home advertising. Print media covers a wide range of audiences including specialist technology and audio magazines.
Radio
Radio is a traditional media channel which broadcasts content and advertisements
over AM and FM radio frequencies, as well as live streaming and podcasts.
How do I best allocate my Advertising Budget?
To get the most out of your advertising budget you will need to know the media viewing habits for each market (being how much do customers watch/use the different media channels). Then, combine this with Advertising Reach (what percentage can be reach for a given spend). This enables you to determine an optimal advertising mix across the channels, as well as how much to spend on each channel.
Media Viewing Habits
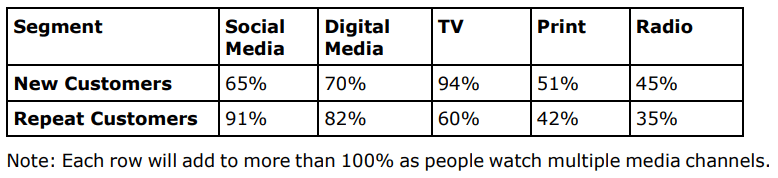
The table below provides the proportion of each market that can be reached using
the different media channels:
Advertising Reach
The Advertising Reach chart shows the proportion of the viewing audience that can be reached in each media channel at different levels of expenditure.
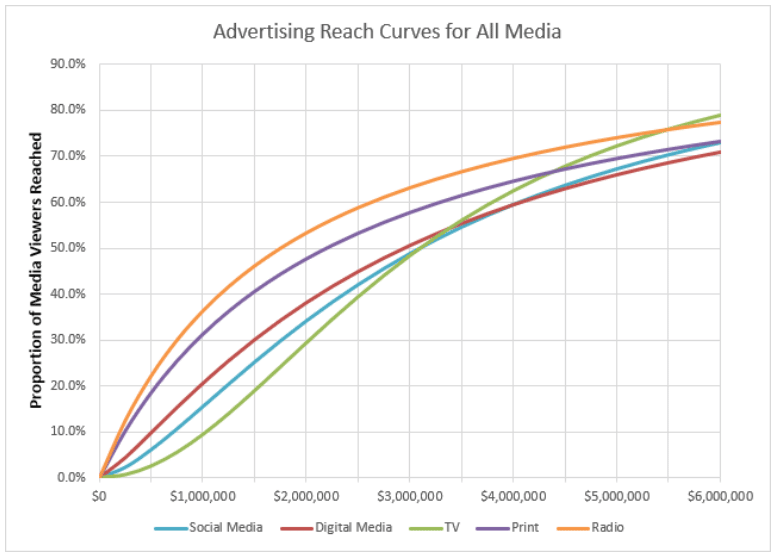
Each media channel has a different shaped curve:
- Some are steep initially and then flatten out, such as Print. This indicates a high audience reach on small investments, but as you spend more the increase in reach decreases significantly.
- Others feature a flatter curve, such as Social Media. This means more investment is required to reach your audience, but the level of reach is relatively constant regardless of total spend.
Worked Example
We can see from the Advertising Reach graph above that that an advertising investment of $2m in TV will reach approximately 30% of all media viewers.
We then look at the Media Viewing Habits table (above) and see that for the New Customer Market we take this 30% and multiply by 94% (New Customers who watch TV) which tells us that 28.2% of the New Customer Market watch TV.
While for the Repeat Customers we take 30% and multiply by 60% (Repeat Customers who watch TV) which tells us that 18% of the Repeat Customer Market watch TV.
Tracking Advertising Performance
Purchase the Audience Coverage, Brand Awareness Tracking Study and the Competitor Media Expenditure reports each year to assess how effective your advertising budget and mix were.