Business Simulation Archives

Accessibility Guide for using Smartsims Business Simulations with a Disability

What are Smartsims Business Simulations?

Smartsims provides Business Simulations which run in a web-browser and are used for teaching in tertiary or higher education courses.

These are period or turn based simulations where you make decisions for an entire year, and then the simulation performs a ‘rollover’ to calculate the results of your decisions. You will then analyze the reports to see how well your company performed, make new decisions, and then the simulation rolls over again.

What are the accessibility features in the Smartsims’ Simulations?

We have developed a guide to explain our accessibility features for users with visual, hearing or mobility impairments and how these interact with assistive technologies such as screen readers (JAWS and NVDA) and pointing devices.

Click to view the Smartsims Accessibility and Assistive Technology Guide for the MikesBikes Introduction to Business Simulation, Music2Go Marketing Simulation, and AdSim Advertising Simulation

Extra support for those with a disabiliy

If you have a physical or learning disability and require additional assistance please contact us. Our team will work with you to provide any additional support or just be there to answer any questions you may have. We can also arrange a phone call to answer your questions if that is easier for you.

Our VPAT / WCAG Documentation

Contact us to obtain our VPAT documentation which summarize our compliance with WCAG 2.0 and the revised Section 508 standards for the MikesBikes Introduction to Business Simulation, Music2Go Marketing Simulation and the AdSim Advertising Simulation.

New Modern & Intuitive Business Simulation Interface

Our new simulation interface is now available for all courses using our:

This has been a long-term project focused on modernizing the interface and decisions, making the user experience more intuitive and improving student’s user experience.

The new interface and navigation experience is built around a new onboarding process, a new company dashboard and decision screens which provide students with relevant information when they need it. We believe these changes will expedite students becoming power users, and therefore, accelerate learning outcomes.

A New Onboarding Experience

When students first log in, and after each rollover, they are provided with information for the year ahead and a short explainer video to help them get started.

And after a rollover key results are displayed:

The New Company Home Page

Students now have a new company dashboard as the default start page:

The Home Page features company info, KPIs, quick links to product decisions and new decisions, key reports and relevant videos for the year ahead.

Top Menu Navigation

A modern top-menu navigation system groups decisions into logical, functional decision areas.

Select menu items feature a drop-down to access a sub-menu:

Intuitive Decision Screens

Our improved decision screens feature information, results and reports all relevant to the decisions they are making on that specific screen. Also, our integrated Live Forecast at the top-right.

Our New Help Widget

The new Help widget includes a search feature, screen-specific FAQs and videos, and links to updated articles, Player’s Manual and access to the Smartsims Support Team.

Improved Report Menu & Reports

An easier to use approach to the Reports menu, sorted by functional area and each includes a description to help students Updated reports and a new search feature.

If you have any questions, feedback or suggestions please contact us.

– January 2022

How to Develop Strategy in MikesBikes

Winning the MikesBikes Business Simulation requires your management team to develop a long-term strategy. As in real life, if you bounce around with your decisions you will incur extra costs without additional benefits. In the section on the Strategic Management Process, we outline the process of developing and implementing strategy.

In the 1980’s, Michael Porter (of the Harvard Business School) did considerable work in defining three types of strategies that “fit” a business unit into its environment. These are called differentiated, cost and focus strategies. These are especially pertinent in the MikesBikes-Advanced scenario. For further information see Michael Porter’s Ideas on Strategy.

Developing and Implementing Strategy

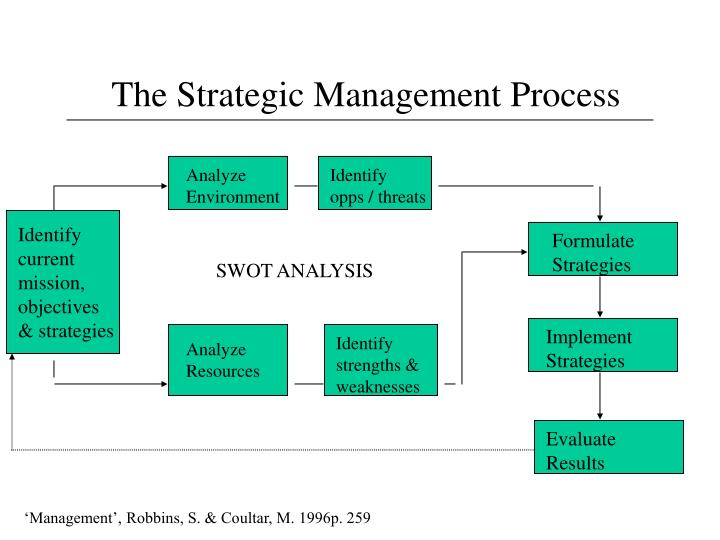
The Strategic Management Process

Making consistent decisions for a firm in all aspects of its operations is difficult without a well defined and clearly integrated strategy. The diagram below summaries a cycle which is sometimes helpful in developing this.

Strategic Management Diagram

Analysis

The first stage in developing a strategy is analysis. A management team should consider both its internal and external environment.

External Analysis: A firm should look at the opportunities and threats in its external environment. This should include a sound analysis of customer needs such as physical attributes, quality, delivery and costs and also the actions of its competitors.

Internal Analysis: A management team should also consider a firm’s own competencies and resources. This may include looking at where the firm is currently positioned, its strengths in terms of quality and delivery and its financial resources.

Synthesis

This relates to pulling together all the data from the analysis phase and determining a strategy. It can be broken up into distinct functional areas, but in reality there is considerable overlap among them and much iteration occurs.

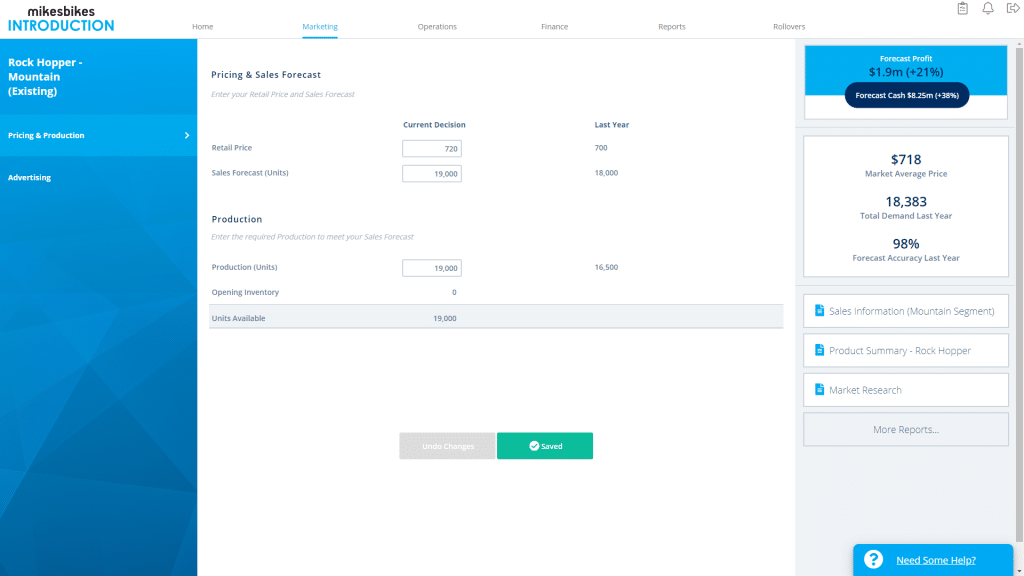
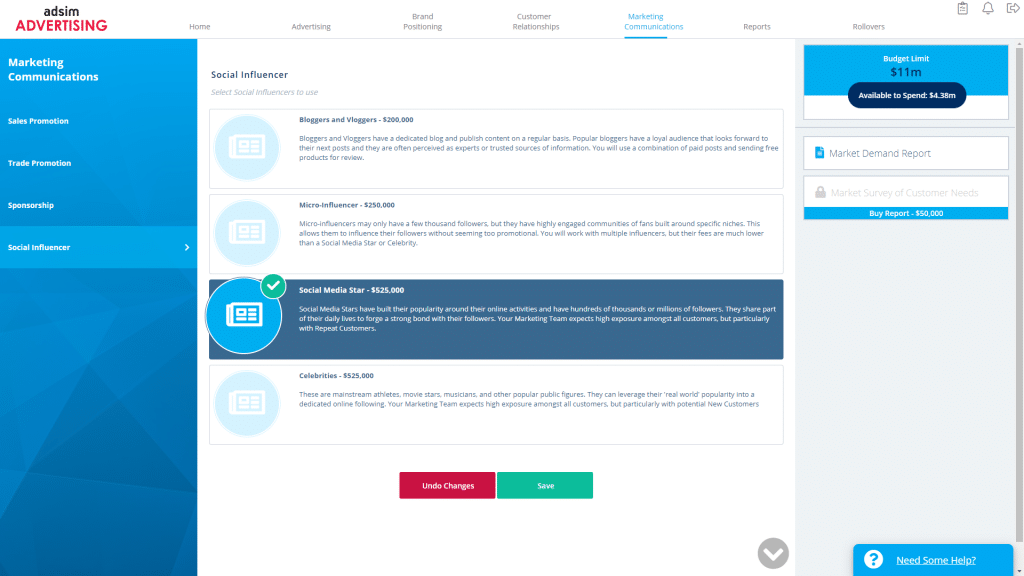
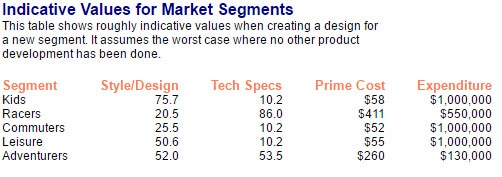
Creating Marketing Strategy: Having completed external and internal analysis, a management team should be able to develop a marketing strategy. An important step in this involves the decision whether to compete in one narrow segment or broadly in several segments. Then the selection of a specific segment or segments allows customer needs to be defined. Once these are defined a firm can begin to implement marketing decisions in areas such as distribution channel selection, price, advertising and production volumes.

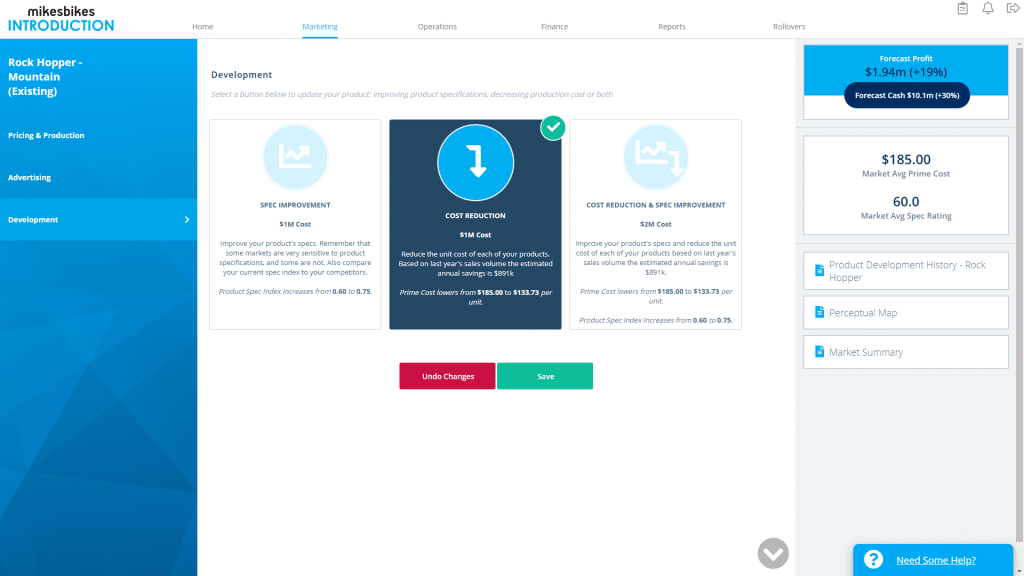
Creating Manufacturing Strategy: A manufacturing strategy should be defined in conjunction with marketing strategy. Strategic decisions may include whether to produce a low cost product, or to try and differentiate it with features and to charge a premium for this.

It also includes making decisions to provide sufficient capacity to produce at the required volumes. It also requires producing goods with the appropriate quality level, delivery speed and cost to meet the needs of target segments.

Creating Financing Strategy: After both the marketing and manufacturing strategies have been defined, the financing strategy can be developed to provide the necessary finance to support investments required by the marketing and manufacturing strategies. The debt/ equity ratio can also be adjusted to balance the risk in the rest of the firm’s operations.

Iterating Strategies

While the process outlined above follows clear sequential steps it is obvious that in reality these are interrelated. Thus it is important reconsider each of the strategies to ensure that the marketing strategy does not make demands beyond the capabilities of manufacturing and that neither the manufacturing or marketing strategies require investments beyond the firm’s ability to finance them.

Implementation

Planning is necessary, but some would say that 10% of the effort is in the planning and 90% is in the implementation. In MikesBikes-Advanced, it is assumed that the outcome of your firm’s decisions depends on the amount of money you commit and on the decisions of the competitor. In reality many more things come into play, such as the quality of the feedback and control systems, the nature of leadership, and the motivation of the people in the organization.

Feedback and Control

In MikesBikes-Advanced, you have feedback at the end of each year of operation. This is the information that allows you to learn and to improve performance in the next year.

Leadership

Leadership can make a huge difference to the performance of an organization. What sort of leadership, by whom, and when, is much more difficult to specify. This is not modeled in MikesBikes-Advanced.

Motivation

Motivation comes from rewards. These rewards can be financial (such as salary, bonuses, cars, etc), or non-financial (such as the satisfaction that comes from the work and being part of a team, the development of a person’s personal skills, etc). A good environment balances these two types for each individual to get the most rewarding environment.

Michael Porter’s Ideas on Strategy

In the 1980’s Michael Porter developed some models for strategic analysis that focused on the five forces presented below. The best industry to be in is one which is most favorable in these areas.

Porter's Five Forces

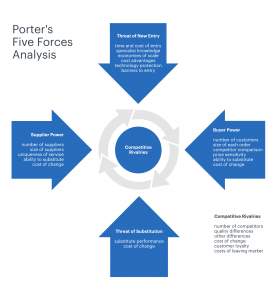
Out of this analysis, he suggests that it makes sense for a Strategic Business Unit to choose one of three “generic” strategies – cost, differentiated, or focus.

The Cost Strategy suggest that one develop the least cost product for a segment. Often this is associated with selling high volumes at lowest price.

The Differentiated Strategy suggests that one develop a unique product and charge a higher margin for it.

The Focus Strategy suggest that one focus on the special needs of a niche segment.

MikesBikes-Advanced is ideally suited to experimenting with these different strategies.

Balanced Scorecard

The term “Balanced Scorecard” was coined by Kaplan and Norton to refer to a framework of financial and non-financial measures which attempts to give a more full and balanced picture of the performance of a firm.

The Balanced Scorecard is composed of four sections:

1. Financial Perspective – e.g. profit, share price.

2. Customer Perspective – e.g. sales, market share, warranty rate

3. Internal Performance Perspective – e.g. efficiency, leadtime

4. Innovation and Learning Perspective – e.g. new products

The idea is that a firm’s progress in implementing a strategy can be represented by improvements on a variety of key measures. These measures must be carefully chosen to be in line with the firm’s strategy and its plan for implementing the strategy.

The Balanced Scorecard approach can be applied in a tiered fashion to construct a performance measurement system for all levels of a company. Many firms use it in their reward/bonus system for their employees.

Measuring Success

Your objective is to create wealth for shareholders and so you will be evaluated on the cumulative change in Shareholder Value that your firm generates.

To see the shareholder value of your firm choose the “Financial Results for All Firms” report from the Key Reports menu.

Being evaluated on shareholder wealth is significantly different from evaluation based on net profit, market share, or earnings per share.

You can read more about this here.

Related Articles

How to Increase Shareholder Value in MikesBikes

Common Mistakes made by Students in MikesBikes

Top 3 Questions Students Ask

MikesBikes Intro (Foundations of Business Simulation) Tutorial Videos

MikesBikes Advanced (Strategic Management Simulation) Tutorial Videos

Smartsims Business Simulation Flyers

Smartsims Simulations Sales Flyer for MikesBikes Introduction to Business, MikesBikes Advanced Strategic Management, MikesBikes Accounting, Music2Go Marketing and AdSim Advertising.

Sales Flyer for MikesBikes Introduction to Business Simulation.

Sales Flyer for MikesBikes Advanced Strategic Management Capstone Simulation.

About Smartsims

Smartsims are experts in Educational Business Simulations with over 20 years’ experience delivering a genuine business experience for K12, higher education and corporate training courses. Our fun and easy-to-use business simulations feature in colleges, universities, high schools and companies around the world.

Smartsims Business Simulations make course content relevant and engaging. The simulation structure keeps students regularly connected with your content and each other, enabling a holistic learning experience.

Scalable. Flexible. Online and Face-to-Face

Scalable and flexible, Smartsims adapt to courses of any length or size.

We have worked with institutions with as many as 3,000 users in single sessions – to others running 1,000 plus students spread over multiple campuses – right down to a single 15 student sections. Face-to-face, online courses or a mix of both.

We partner with you to assist with integration, develop course content and structure. We have a wide-range of existing integration options or can customize if required. Setup is easy and the simulation is completely automated, with your own interface for monitoring the simulation.

Contact us today to learn more about Smartsims and to schedule an online demonstration with one of our team!

best practice teaching online with simulations

Smartsims Business Simulations in Select Journal Articles & Conferences

The following are a selection academic papers featuring our MikesBikes Introduction to Business Simulation and MikesBikes Advanced Strategic Management Simulation.

Using Assessment To Measure The Effectiveness of a Financial Simulation

Abstract: This study examines how useful a financial simulation is at reinforcing financial learning goals as measured by an assessment. Programs within many College of Businesses are under increasing pressure to demonstrate that students are learning within their courses, assessment is one method of documenting learning. Most accreditation certifications require colleges to provide an assurance of learning using assessment techniques at the course and program levels. Business simulations play a potentially significant role in reinforcing course learning goals which are measured by assessments and document the assurance of learning process. Results indicate an improved comprehension of financial learning objectives for students after completing a business simulation with financial content.

Nugent, N., Stoyanov, S. (2019), Using assessment to measure the effectiveness of a financial simulation. Developments in Business Simulation and Experiential Learning, 46 (2019), 187-198.

Business Simulation Performance After Completing a Reflective Observations Module

Abstract: Many factors can contribute to a student’s successful learning experience when participating in a business simulation as part of their undergraduate curriculum. It’s important for faculty to understand the best methods to deploy simulation assignments to students. Is there a benefit to having students answer a set of reflective observation questions? Reflective observation questions ask students to think about their past actions, and to describe the effects their decisions have on their simulation performance. The main objective of this research: using comparative data from two classes to define the effectiveness of student performance within a business simulation after completing sets of reflective observation questions after each round of the simulation.

Nugent, M. (2018). Business simulation performance after completing a reflective observations module. Developments in Business Simulation and Experiential Learning, 45 (2018), 31-41.

Business Simulation Team Performance After Completing and Individual Practice Module

Abstract: Many factors can contribute to a student’s successful learning experience when participating in team based simulations. What is the best way to deploy simulation assignments to students? Is there a benefit to having students complete a significant amount of simulation practice rounds before competing against each other in a team environment? The main objective of this research: using comparative data from two classes to define the effectiveness of student team performance within a business simulation after an individual simulation practice assignment has been completed.

Nugent, M. (2014). Business simulation team performance after completing an individual practice module. Developments in Business Simulation and Experiential Learning, 41(2014), 157-164.

Instructing undergraduates in marketing strategy: from hindsight to foresight

Abstract: We are very good at instructing our students with explanations of the past. Unfortunately, prior research has noted that many business postgraduates misuse theory, as they tend to apply concepts they have been taught in the past, rather than adapt and apply foresight to a particular present context. Highly controversial work published earlier exposed the misuse of the popular Boston Consulting Group (BCG) matrix. Empirical evidence revealed that the BCG matrix leads to poor strategic marketing decisions causing managers to focus upon market share rather than profitability. In this present study, the earlier work is extended, using more controls and a larger suite of experimental conditions. A series of experiments were conducted, working with a sample of 221 executives in-training and experienced practitioners, in North America and New Zealand.

Spanier, N., (2013). Instructing undergraduates in marketing strategy: from hindsight to foresight. Marketing Education: New Challenges and Opportunities, 2013, 40-50.

The Development & Implementation of Business Simulations in Higher Education in the United Kingdom

Abstract: This thesis is a study of the development and implementation of business simulations/games in United Kingdom Higher Education institutions. The research takes an holistic approach and examines the topic from the perspective of developers of business simulations, academics who choose to implement simulations in their teaching, and students who are the end users of business simulations.

Doonga, N. (2013). The development and implementation of business simulations in higher education in the United Kingdom. OpenAIR@RGU.

Gender and Comparative Evaluations in Student Groups

Abstract: It is well documented that students generally overestimate their grades in coursework, and some studies have found that male students overestimate their test scores more than females do. This study examines gender differences when self-evaluations are compared to peer evaluations within student groups. Differences are found between male students and female students in their ability to accurately judge their own contributions in group work relative to the evaluations they receive from their peers.

Ammons, J. L., Brooks, C. M. (2013), Gender and comparative evaluations in student groups, Academy of Educational Leadership Journal, 17(2) 39-46.

Practitioner Heuristics: Adapting Student to Co-op Placement

Abstract: When people make efficient decisions that ignore some information or cues, they use their natural, intuitive ability to employ heuristics. The effectiveness of heuristics depends on the appropriateness to a given context.

Spanier, N., Franklin, D. (2013), Practitioner heuristics: adapting student to co-op placement, New Zealand Association for Cooperative Education: Strategic Directions in Cooperative Education, 31-33.

Learning to Lead: Mind Games for Middle Managers

Abstract: Middle management in tertiary education is a role made challenging by the current popularity of distributed leadership, allied with the mutually incompatible demands of the job, described in the Integrated Competing Values Framework. Middle managers need knowledge and experience to manage those challenges but these are not skills which are acquired quickly. Scenario based learning, role playing and games have been identified as effective ways of developing that knowledge and experience and demonstrating desired behaviours by problem solving familiar or recurring issues, in an environment people recognise.

Morgan, S. (2012). Learning to lead: mind games for middle managers. Tertiary Education Management Conference: Refereed Papers, 2012, 129-135.

Capital Structure and Dividend Policy in an Intro to Business Course

Abstract: At the undergraduate level, capital structure and dividend policy are generally introduced in a basic finance class and further developed in advanced courses in corporate finance. Exposure to the concept of shareholder wealth maximization earlier in the curriculum would be beneficial for student understanding of business decision-making. It is difficult to grasp the complexities of the process without some basic appreciation of the financing aspect of those business decisions. This paper outlines a pedagogical method for incorporating capital structure and dividend policy decisions into an Introduction to Business course through the use of a business simulation.

Reid, S., LaBonia, L., Shaw-Ching Liu, B., Luoma, P., and Asare, A. (2009). Capital structure and dividend policy in an intro to business course. Journal of Instructional Techniques in Finance, Spring (2009).

Learning Assurance Using Business Simulations: Applications to Executive Management Education

Abstract: Today the number of working managers returning to the classroom is growing rapidly as a result of globalization and technological developments. Many students are enrolling in executive management degree programs (EMBA) which feature flexibility and a focus on results. While most EMBA programs are delivered in a different format than the traditional MBA program the requirement for learning assurance is still essential. Simulations, which are used extensively throughout most EMBA programs as part of the experiential learning process, provide one approach for evaluating the effectiveness of curriculum design and delivery. The purpose of this paper is to illustrate how simulation in concert the development of rubrics can be used to support the learning assurance process in EMBA type programs.

Hall, Owen P. Jr. & Ko, Kenneth. (2006). Learning assurance using business simulations: applications to executive management education. Developments in Business Simulation and Experiential Learning, 33(2006).

Mike’s Bikes: Net Mike Version

Smith, P., Carrie, D. (2004). Mike’s Bikes: Net Mike Version. Simulation & Gaming (SAGE) 35(4), 527-529.

Mike’s Bikes: Solo Mike Version

Smith, P., Carrie, D. (2004). Mike’s Bikes: Solo Mike Version. Simulation & Gaming (SAGE) 35(4), 525-535.

MikesBikes-Business-Simulation-featured-in-Rethinking-Undergraduate-Education

MIKESBIKES BUSINESS SIMULATION IN “RETHINKING UNDERGRADUATE BUSINESS EDUCATION”

The [MikesBikes] business simulation does a superb job of teaching students to link concepts with experience and motivating them toward their future studies in business.

COLBY, A., EHRLICH, T., SULLIVAN, W. & DOLLE, J. (2011) RETHINKING UNDERGRADUATE BUSINESS EDUCATION: LIBERAL LEARNING FOR THE PROFESSION

Rethinking Undergraduate Business Education: Liberal Learning for the Profession Textbook

What the book covers: Business is the largest undergraduate major in the United States and still growing. This reality, along with the immense power of the business sector and its significance for national and global well-being, makes quality education critical not only for the students themselves but also for the public good.

The Carnegie Foundation for the Advancement of Teaching’s national study of undergraduate business education found that most undergraduate programs are too narrow, failing to challenge students to question assumptions, think creatively, or understand the place of business in larger institutional contexts. Rethinking Undergraduate Business Education examines these limitations and describes the efforts of a diverse set of institutions to address them by integrating the best elements of liberal arts learning with business curriculum to help students develop wise, ethically grounded professional judgment. (Google Books)

MikesBikes at Santa Clara University

The textbook covered MikesBikes in Chapter 3 on “The Challenges of Undergraduate Business Education.” They interviewed a Santa Clara University instructor on how MikesBikes is currently used in the Contemporary American Business Course – a course that is required for all entering business majors at the Leavy School of Business.

MikesBikes in Contemporary American Business Course

[MikesBikes] provides a “liberal arts” experience in that it gives the “broad exposure” that is the aim of a survey course. And certainly we were impressed with students’ level of engagement, intellectual energy, and seriousness – qualities one wants to see in all aspects of a college education.

INSTRUCTOR FROM SANTA CLARA UNIVERSITY

Santa Clara University has been using MikesBikes for many years now. The course is designed to provide an overview of business as a field.

The course includes standard classroom presentations, multiple choice examinations and one-third of the students final grade is dependent on their performance in the MikesBikes simulation. They run the simulation for the whole semester.

The first half of the semester allows the students to get familiar with the simulation and concepts through the Single-Player, practice phase. In the second half, they work in teams and compete against other teams in the course to achieve the highest Shareholder Value.

In MikesBikes, students are given an opportunity to work in marketing, production, product development, finance and accounting. Each member of the team are responsible in making decisions in these functions, allowing them to develop and make complex strategic decisions.

The course through the use of the MikesBikes business simulation provides students with an experiential learning environment, allowing them to take on realistic roles in a manufacturing bike company. They learn how to think critically and coordinate a management strategy. They experience the highs and lows of running a business, the excitement and risks all in a fun, and safe learning environment. In addition, working in teams allow them to learn about the importance of trustworthiness and integrity.

Reference: Colby, A., Ehrlich, T., Sullivan, W. & Dolle, J. (2011) Rethinking Undergraduate Business Education: Liberal Learning for the Profession, Stanford, CA: Wiley.

Ready to take your course to the next level?

Increase student engagement and motivation with Smartsims Business Simulations. Contact us to learn more.

Production Efficiency in MikesBikes

Question of the Week: Why is my production efficiency low? | MikesBikes Advanced Business Simulation

A factory efficiency of around 70%-80% is very good. However, if you have a factory efficiency lower than this, then continue reading to identify what the issue is and how you can resolve it.

There are several factors as to why your factory has low efficiency. Check the following:

1. Raw Materials Stockout

Consider increasing your raw materials inventory or improve your relationships with your suppliers.

Raw Materials Inventory is the number of weeks worth of raw materials you wish to keep on hand. A higher inventory will help to avoid lost capacity through raw material stock outs. This does come at a price however, as each unit of raw materials incurs a holding charge.

Supplier Relations are expenditure that could be directed at negotiating single source contracts, providing suppliers with demand forecasts and educating suppliers in Just-In-Time and Total Quality Management techniques. It may also extend to paying incentives to suppliers who provide quality products, consulting suppliers when designing new products and paying increased transport costs to enable more frequent deliveries.

The benefits of investing in supplier relations include reducing line stoppages due to reduced unavailability and/or inadequate quality of materials. Current relationships with suppliers are only about half as good as they could be. It will require a significant investment to improve supplier relations, but once improved it will require a lower level to maintain this improvement as the level of accumulated supplier relations deteriorates over time.

2. Setup Time

You may want to consider increasing your batch size or spend more on reducing setup times.

Setup Time Reduction Expenditure includes expenditure on analyzing set up procedures and developing and documenting new statements of procedure. It also includes expenditure on plant modifications to facilitate quick changeovers.

Investment in set up time reduction will reduce the amount of time spent setting machines up and hence increase effective capacity (provided batch size remains constant). Other factors affecting the capacity lost to setups are: batch size, number of products, and product complexity.

We assume that there is a standard setup time of about 4 hours per setup. By investing in setup time reduction we can reduce this. Over the last 5 years setup times have been reduced by 5%. With the present batch sizes and number of products, each firm is losing about 10% of theoretical factory capacity on setups.

3. Rework Time

You may want to look at improving the skills of your staff through training, increasing expenditure on the maintenance expenditure of your factory and increasing your supplier relations expenditure.

4. Breakdowns

You may want to consider increasing your expenditure in preventative maintenance.

5. Idle Time

Idle Time is an inefficient use of resources causing higher average manufacturing costs per bike. You need some idle time to cater if there is higher demand in your products than expected, however having too much Idle Time is costly. To reduce this, you may look at selling some of your excess factory capacity and/or firing some of your workers to reduce your factory capacity.

Have a question that would like answered or featured in an article? Contact us here.

Check out our latest articles:

Standard Segment in Music2Go featured image

Market Segments in Music2Go Marketing Simulation: Standard Segment

This article will be a three-part series introducing the market segments in Music2Go Marketing Business Simulation. In this article, we’ll be talking about the Standard Segment.

Market Segments in Music2Go Marketing

There are three market segments in Music2Go – Standard, Youth, and Sports (Multi-Player only).

These segments have different sizes, projected growth, sensitivity to price, advertising, distribution, and product specs.

You start with a single MP3 Player product in the Standard market segment. Starting in Year 3 (after 2nd rollover) you may improve your existing product and/or launch additional products into new market segments (up to a maximum of 4 products by Year 6). Part of the challenge of Music2Go is in being able to balance the needs of your products within your limited marketing budget.

Standard Segment

Consumers in this segment tend to be less active than those in the Sports segment and thus do not require the high level of technological specifications inherent in sports designs. While young adults in this segment share the purchasing ability of their sports counterparts, they are more price conscious, which is reflected in the relative pricing between these two segments.

  • Medium priced ($85 – $100) with high price sensitivity
  • Price range is $40 to $120, but the recommended range is $85 to $100.
  • Medium sensitivity to advertising
  • High sensitivity to distribution coverage
  • Low sensitivity to product specifications
  • Consumer style / tech spec preferences change slowly, so segment moves
    slowly on perceptual map.

Since consumers in this segment are highly price sensitive, you can expect some price competition. Plan for this with cost reduction projects to maintain acceptable unit margins. However, be careful of engaging in a price war. No one wins a war. This is the slowest moving segment and has low sensitivity to product specs. So you may only require a single product spec improvement project midway through the simulation to remain competitive. It is the largest of the three segments but has minimal underlying growth.

You will be selling a single Standard Segment music player in the first two years of the simulation. After the 2nd rollover you may launch additional products into the Youth and Sports segments (Multi-Player only).

Related Articles: 
group of people with thumbs up - business simulations are where mistakes are encouraged

Business Simulations: where making mistakes are encouraged

Making mistakes simply means you are learning faster.

Weston Agor

Who likes making mistakes? Majority of us probably don’t like making one or try our best to avoid it.

In school, we always thrive to do the best we can to avoid making mistakes in our exams or essays to avoid failing.

At work, would you hire someone who says they often make mistakes or promote someone who constantly does? Majority of employers probably wouldn’t.

Here at Smartsims Business Simulations, we believe that we often learn best and the most when we fail, and make mistakes. This allows us to look back, analyze what and where we have gone wrong and restart. If there’s an opportunity, we can also get feedback from our mistakes. This gives us a brand new start to take action and hopefully never make the same mistake again.

However, realistically, we seldom get a second shot to do all these, right? Professors in universities will rarely allow you to redo an exam you already failed. You won’t get another shot of winning that soccer match you already lost. You would lost an opportunity to get promoted if you missed your quota.

Good news is with Smartsims Business Simulations, failure and mistakes are encouraged!

The foundation of simulation-based learning is that we learn by doing. Our objective is to give students an opportunity to have their own business experience, and mirror what it’s like in the real world. This allows them to take responsibility over their own learning and become personally engaged with the content. They get to manage their own company in a fun and safe environment, while allowing them to learn through trial and error, testing different decisions and strategies.

Every business simulation includes a practice and competitive application. Once students are familiar with the simulation format, their teams develop strategy and make key decisions for their organization. Students use real-time market and business reports to effectively analyze market conditions; develop strategy; and, evaluate the impact of their choices.

All our business simulations provide students with a platform to develop an understanding of business concepts, make strategic and critical decisions, and allow them to see the immediate impact of their decisions.

Here, failure is encouraged and allowed, so that they can try better approaches and methods.

Provide your students with a unique learning opportunity and take your course to the next level with Smartsims. Contact us to learn more.

Correcting a failed product development project

Question of the Week: How do I correct a failed Product Development Project? | MikesBikes Advanced Business Simulation

You want to get product development projects right the first time as this can be a costly mistake. It can mean either your Unit Prime Cost is higher than you want and/or your specifications are not as you wanted resulting in a lower demand for your product if they are wrong.

There could be two reasons why your project failed:

1. The project/budget expenditure was too low and/or
2. The requested unit prime cost was unrealistically low

As in real life, you do not want to commit to a product development project without checking that it was appropriately funded and that it would be able to provide an acceptable return on investment.

In addition, you have to be careful that the specifications you enter for your new product actually fall close to the ideal point of the segment you are targeting. Look under Key Reports for Perceptual Map of Market Segments to check this. Products outside the radius of influence (i.e. outside the circles) will not sell at all.

How do we conduct successful development projects?

We will walk you through an example where we develop the design for a racers bike. While the specifics and calculations may change, the steps you follow will be the same:

1. View the Indicative Values for Market Segments within the Product Development Scenario Information report to view the ideal product attribute levels desired by each segment.

(Note: These desired product attributes by each market segment change slightly from year to year so be sure to keep monitoring for the changes.)

Indicative Values for Market Segments

2. Take the current Style/Tech Specs of your closest existing Design Project and calculate the required change in Style/Design and Technical Specs.

In our example, the closest existing Design Project is our Adventurer Bike. You can view the Product Development Project Results Report to view your closest existing design paying attention to the Style/Design and Technical Specs:

Product Development Project Results Report

3. Calculate the difference in Style and Technical Specifications between the desired design and the closest existing design.

As you can see, in this example, our only and closest existing design project is our Adventurer product. This features specifications of 50 Style and 60 Technical. Our desired design project has targeted specifications of 20 Style and 86 Technical.

So the difference is 30 Style and 26 Technical.

Estimated Costs and Time Frames

We can see on the Product Development Scenario Information report that each unit of Style development costs $1000 and each unit of Technical development costs $20,000.

Our example calculation will be:

30 x $1,000 added to 26 x $20,000 = $550,000

Therefore, our design cost would be $550,000 on the new design to achieve 20 Style and 86 echnical.

4. Calculate your prime cost.

From the table above we can see that the prime cost will be calculated at roughly $0.1 to $0.15 per design and $4.50 to $5.00 per technical specification. We want a racers bike with 20 style/design and 86 technical specifications.

A conservative calculation would therefore be:

0.15 x 20 added to 5.00 x 86 = $433

If we enter any additional expenditure on to our design cost this will be used to further reduce the Prime Cost.

Note: This does NOT mean you should always aim super low with target Prime Cost.  If you aim too low, then your project won’t have enough money to achieve its objectives and you will miss your style / tech spec targets as well as your prime cost target.

How do I correct a failed product design?

A failed product design is a design that shows anything less than 100% success rate within the Product Development Results Report. Unfortunately this means you will need to design the design again. However! The failed design is likely to be a lot closer to your desired specifications than the previous closest design, thus it means it is likely to be cheaper to invest in. Simply follow the process above again working off the new closest existing design (even if the closest existing design is a failure).

Check out our Common Mistakes in MikesBikes Advanced article.