Marketing Simulation Hints Tips Cheats Archives

Standard Segment in Music2Go featured image

Market Segments in Music2Go Marketing Simulation: Standard Segment

This article will be a three-part series introducing the market segments in Music2Go Marketing Business Simulation. In this article, we’ll be talking about the Standard Segment.

Market Segments in Music2Go Marketing

There are three market segments in Music2Go – Standard, Youth, and Sports (Multi-Player only).

These segments have different sizes, projected growth, sensitivity to price, advertising, distribution, and product specs.

You start with a single MP3 Player product in the Standard market segment. Starting in Year 3 (after 2nd rollover) you may improve your existing product and/or launch additional products into new market segments (up to a maximum of 4 products by Year 6). Part of the challenge of Music2Go is in being able to balance the needs of your products within your limited marketing budget.

Standard Segment

Consumers in this segment tend to be less active than those in the Sports segment and thus do not require the high level of technological specifications inherent in sports designs. While young adults in this segment share the purchasing ability of their sports counterparts, they are more price conscious, which is reflected in the relative pricing between these two segments.

  • Medium priced ($85 – $100) with high price sensitivity
  • Price range is $40 to $120, but the recommended range is $85 to $100.
  • Medium sensitivity to advertising
  • High sensitivity to distribution coverage
  • Low sensitivity to product specifications
  • Consumer style / tech spec preferences change slowly, so segment moves
    slowly on perceptual map.

Since consumers in this segment are highly price sensitive, you can expect some price competition. Plan for this with cost reduction projects to maintain acceptable unit margins. However, be careful of engaging in a price war. No one wins a war. This is the slowest moving segment and has low sensitivity to product specs. So you may only require a single product spec improvement project midway through the simulation to remain competitive. It is the largest of the three segments but has minimal underlying growth.

You will be selling a single Standard Segment music player in the first two years of the simulation. After the 2nd rollover you may launch additional products into the Youth and Sports segments (Multi-Player only).

Related Articles: 

Customer Relationship Management in AdSim Advertising Simulation

Three periods into the simulation and you will be given control of your firm’s Customer Relationship Management strategy. Customer Relationship Management or CRM is an approach to manage a company’s interaction with current and potential customers.

The purpose of a Customer Relationship Management strategy in the AdSim Advertising Simulation is to decide which policies you will implement to try and keep Existing Customers loyal to your brand.


In AdSim you are required to make decisions about four elements of your Customer Relationship Management strategy:

  • CRM SYSTEM

Decide whether or not you want to invest in a Customer Relationship Management database system? And if so what type? Entry level, Mid-Level or Custom Built.

  • WARRANTY

What length of Warranty that you want to offer your customers? 90 Days, 180 Days, One Year or Two Years.

  • SUPPORT

What level of a customer service do you want to provide? A manual, a knowledge base, Support Center, SmartCare.

  • LOYALTY

What type of customer loyalty program do you want to administer? A regular newsletter, a photo contest, video contest.

You are required to choose which option you think best targets your customers within your budgetary constraints.


You will be able to measure the effectiveness of your Customer Relationship Management strategy through the Market Demand report and the Market Survey of Customer Needs. These are available on the CRM decision screen.


Related Articles:

Part 2: Common Mistakes in Music2Go Marketing Simulation

Mistakes are the stepping stones to success.

– John C. Maxwell

What are the other common mistakes in Music2Go Marketing?

In Part Two, we’ll talk about the importance of reaching the right customers and how to better allocate your Sales Promotion Mix.

Here’s Part One of the article in case you missed it.

Mistake #4: Misunderstanding the Importance of Reaching the Right Customers

Not understanding this can be a costly mistake as it often leads to incorrectly assigning your Advertising Mix. This can have a negative impact on the demand for your products and can also lead to overspending. Meaning your firm’s profitability is at risk!

How do you know if you are spending your advertising budget inefficiently? Follow through this section, it will show you how to efficiently allocate your advertising budget.

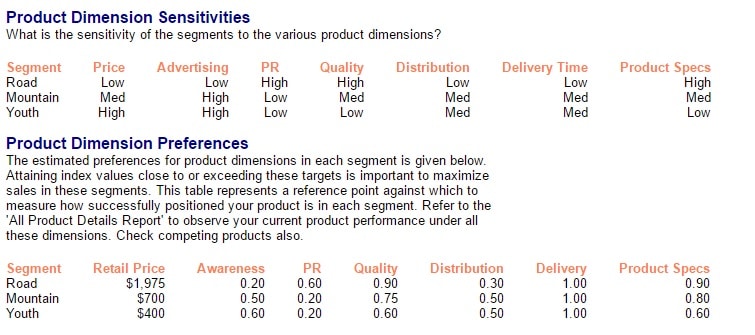
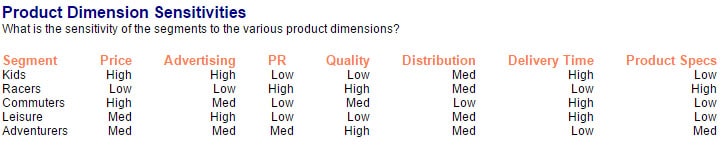
Each market segment is sensitive to different dimensions. View the Market Information report.

Product Dimension Sensitivities in Music2Go

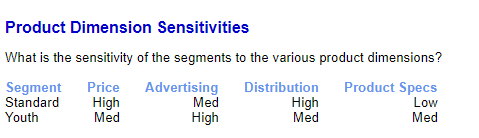
How do I interpret this Product Dimension Sensitivities graph?

The best way to explain it is through an example. If you take the Standard segment, you’ll see it has a high sensitivity to Price. This means that an increase to your price (example setting the price to the maximum) is going to have a negative effect on your sales volume.

What these sensitivities mean is a change in any of these factors, will result in a proportionate change in the consumers’ demand for your product(s).

There are four media choices to develop your advertising mix on: Television, Newspapers, Magazines and Digital Media.

There are two substantial sources of information you can use to determine your optimal advertising mix for a given advertising spend: Advertising and PR Reach by Media Curve and Media Viewing Habits. Both information can be found in the Market Information report.

Each media type can reach a given proportion of its audience for a given investment. This is shown within the Advertising and PR Reach by Media Curve.

The best way to explain this would be to provide an example.

Example: Budget of $4 million on Standard Segment.

Option 1: 42% of the Standard Segment read magazines.

So our $4 million spend would reach approximately 90% (taken from the graph at a spend of $4 million) x 42% (Media Viewing Habits) =  37.8% of the Standard segment can be reached

Option 2: 85% of the Standard Segment can be reached via Digital Media.

So our $4 million spend would reach approximately 50% (taken from the graph at a spend of $4 million) * 85% (Media Viewing Habits) = 42.5% of the Standard segment

Option 3: But maybe we can do better than that still. What happens if we spend $2 million on Newspapers, and $2 million on Magazines?

If we spend $2 million on Newspapers, we could reach approximately 40% of Newspaper viewers and 58% of the Standard segment reads Newspapers. So we could reach approximately 40% (Media Viewing Habits) x 58% (taken from the graph at a spend of $2 million) = 23.2% of the Standard Segment.

If we spend $2 million on Magazines we could reach approximately 50% of Magazine viewers and 42% of the Standard segment reads Magazines. So we could reach approximately 50% (Media Viewing Habits) x 42% (taken from the graph at a spend of $2 million) = 21% of the Standard segment.

So, together our $4 million spent half on Newspapers and half on Magazines would reach approximately 44.2% of the Standard segment, which is obviously a better use of our Advertising budget than the first two options.

As you can see, with the same budget, but a different allocation towards each media channel can make a huge difference in the amount of consumers you can reach.

This is only an example of good and bad marketing mixes. This is far from the best mix you can make. We suggest playing around on different Marketing Mix and see what works best for your strategy and budget.

Mistake# 5: Inaccurately Allocating Your Sales Promotion Mix

Your Sales Promotion strategy will need to vary with the Life Cycle of your product. For instance, Trade Shows and Sales Force training will be important a new product launch, bur progressively less so as the product ages. Your existing product will be in the Mature phase of its life cycle for your first Sales Promotion decision (Sales Promotion decisions are available after the 1st rollover).

It is important that you get your Sales Promotion Mix right, because it helps boost your distribution coverage and distribution index. In addition, some segments are particularly sensitive to Distribution, such as the Standard Segment.

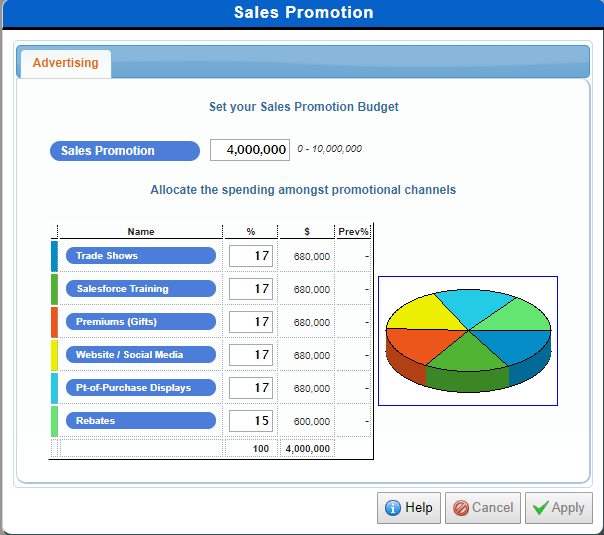
There are 6 types of Sales Promotion activities available to you to promote your products and support your distributors:

  • Trade Shows
  • Salesforce Training
  • Premiums (Gifts)
  • Website/Social Media
  • Point of Purchase Displays
  • Rebates
So, how do I choose a Sales Promotion Mix for my products? 

Remember that each of your products will progress through the Product Life Cycle starting in the Growth phase for new products and then gradually progressing through to the Decline stage over the next six rollovers.

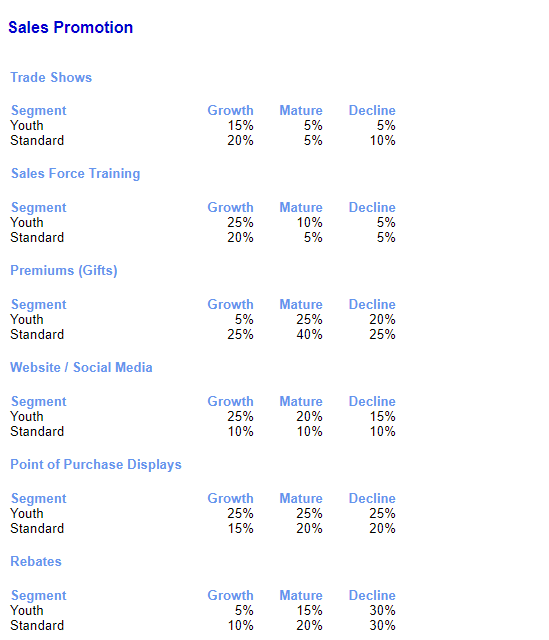
Say we launch a new Youth product this period. This new product will start in the Growth phase of the Product Life Cycle (See Market Information Report > Sales Promotion). Then from looking at the tables above, we can see that our Ideal Sales Promotion Mix for a new Sports product is:

  • Trade Shows – 15%
  • Sales Force Training – 25%
  • Premium (Gifts) – 5%
  • Website and Social Media – 25%
  • Point of Purchase Displays – 25%
  • Rebates – 5%

Total = 100%

That was a simple example, but what happens in the second year that we sell this Youth product? The product will be moved from the “Growth” phase to “Growth – Starting to Mature.” So the optimal Sales Promotion mix will be 1/3 of the way between the ideal Growth and Mature figures in the Sales Promotion Table. That would give us an optimal Sales Promotion mix something like:

  • Trade Shows – 10% (Ideal Growth = 15%, Ideal Mature= 5%)
  • Sales Force Training – 17% (Ideal Growth = 25%, Ideal Mature= 10%)
  • Premiums (Gifts) – 15% (Ideal Growth = 5%, Ideal Mature= 25%)
  • Website and Social Media – 23% (Ideal Growth = 25%, Ideal Mature= 20%)
  • Point of Purchase Displays – 25% (Ideal Growth = 25%, Ideal Mature= 25%)
  • Rebates – 10% (Ideal Growth = 5%, Ideal Mature= 15%)

Total = 100%

You should buy the Distribution Coverage and Sales Promotion Market Research report for detailed information on the Sales Promotion Rating and Stage of Product Life Cycle for all firms in the Industry. 


Common Mistakes in Music2Go Part 1

Part 1: Common Mistakes in Music2Go Marketing Simulation

“During a research experiment a marine biologist placed a shark into a large holding tank and then released several small bait fish into the tank.

Shark Story

As you would expect, the shark quickly swam around the tank, attacked and ate the smaller fish. The marine biologist then inserted a strong piece of clear fiberglass into the tank, creating two separate partitions. She then put the shark on one side of the fiberglass and a new set of bait fish on the other.

Again, the shark quickly attacked.  This time, however, the shark slammed into the fiberglass divider and bounced off.  Undeterred, the shark kept repeating this behavior every few minutes to no avail.  Meanwhile, the bait fish swam around unharmed in the second partition.  Eventually, about an hour into the experiment, the shark gave up.

This experiment was repeated several dozen times over the next few weeks.  Each time, the shark got less aggressive and made fewer attempts to attack the bait fish, until eventually the shark got tired of hitting the fiberglass divider and simply stopped attacking altogether.

The marine biologist then removed the fiberglass divider, but the shark didn’t attack.  The shark was trained to believe a barrier existed between it and the bait fish, so the bait fish swam wherever they wished, free from harm.”

The short story above is by Marc Chernoff.

What do you think is the moral lesson of this story? 

The lesson here is many of us give up after experiencing failures. Like the shark story, we believe that if we were unsuccessful in the past, then we will always be unsuccessful. We continue to see barrier in our heads, even when there are no “real” barriers.

So you are probably reading this article because you want to get out of a situation where you have made mistakes in the simulation and want to fix it, right? Good on you for crossing that barrier!


Mistake #1: Not purchasing Market Research Reports

Purchasing Market Research reports in Music2Go

We cannot reiterate enough how important this is. Many students want to “save” their budget and invest it in other areas in the simulation. However, knowledge is power and by investing in these paid reports, you are making more informed decisions.

Mistake #2: Having leftover Marketing Budget

Marketing Budget Report in Music2Go

Your budget does not carryover to the next year, so it is important that you spend the entire Marketing Budget that you have been given for the current year.

Mistake #3: Misunderstanding the Importance of Pricing Products Correctly

Price is usually a key determinant of demand and is the most critical component to maximizing your revenue. Therefore, carefully thinking about your Pricing strategy is important as this would have an impact on the demand for your products.

Check out this article on How to Set Retailer Price and Retailer Margin for your products.


Part 2 talks about Misunderstanding the importance of reaching the right customers and inaccurately allocating your Sales Promotion Mix.

Music2Go Inventory Costs

Question of the Week: What are the Inventory Costs in Music2Go Marketing Simulation?

There are two types of inventory costs in Music2Go.

Inventory Holding Cost

Each year all firms are charged 3.5% of the value of their average closing inventory for inventory holding costs to cover the cost of warehousing etc.

For instance, if you have 1 million units of unsold stock at the end of the year at a cost of $40 per unit, then you have $40 million of inventory which will cost:

3.5% *$40 million = $1.4m in holding cost

Inventory Disposal Loss

If a firm updates a product with a new design or abandons it altogether then all existing inventory is dumped at 93.5% of what the firm paid for it.

Example:

$1 million of inventory would be dumped for $935K giving a loss of $65K.

You can gather some valuable market research from looking at the figures for your competitors. Firms that have no inventory holding costs have stocked out, because they are under forecasting demand for their products. Firms with large inventories are over forecasting demand. If you see any inventory disposal costs, then you know that your competitor has either updated an existing product’s design or abandoned one.

Related Articles:

How to Set Retailer Price and Retailer Margin in Music2Go

Improving Total Marketing Contribution

Need extra help?
  • You can receive an immediate answer to a number of commonly asked questions through our Support Center.
  • Contact us here.

Reference: 

This Photo by Unknown Author is licensed under CC BY

Music2Go Marketing Factory

Question of the Week: Why did I receive a different number of units from what I ordered? | Music2Go Marketing Business Simulation

In Music2Go you make decisions for an entire year, but your factory has a limited ability to adjust the number of units produced to try to meet actual demand during the year. This is called Demand Responsiveness.

Demand Responsiveness allows the actual number of units ordered to increase or decrease by up to 20% to meet the actual demand for your product.

For instance, if you ordered 1 million units of a product, then the actual number of units delivered could vary between 800,000 units and 1.2 million units depending on actual demand.

Product Contribution Report in Music2Go Marketing

In our example above, we ordered 1.9 million units of our Sonic product, but the Actual Units ordered was less than this at 1.5 million because the demand for our products was less than what we anticipated to sell.

Note: Most worlds have 20% Demand Responsiveness enabled, although your instructor may request this to be modified or disabled for your Multi-Player. 

Related Articles
Music2Go Sales Promotion Screen

Question of the Week: What is Sales Promotion? | Music2Go Marketing Simulation

Sales Promotion

Sales Promotion in Music2Go works by boosting your distribution coverage and distribution index. You should buy the Distribution Coverage and Sales Promotion Market Research report for detailed information on the Sales Promotion Rating and stage of Product Life Cycle for all firms in the Industry.

There are 6 types of sales promotion activities available to you to promote your
products and support your distributors:

  • Trade Shows
  • Salesforce Training
  • Premiums (Gifts)
  • Website / Social Media
  • Point of Purchase displays
  • Rebates

Each promotional activity has particular relevance to certain stages of the Product Life Cycle as outlined below. Note that the Distribution Coverage and Sales Promotion Market Research report will show the age and stage of product life cycle for every product on the market, as well as the Sales Promotion Rating and the Promotion Mix effectiveness.

Choosing a Sales Promotion Mix

Sales Promotion Mix in Music2Go Marketing

Remember that each of your products will progress through the Product Life Cycle starting in the Growth phase for new products, then gradually progressing through to the Decline stage over the next six rollovers.

Say we launch a new Sports product this period. This new product will start in the Growth phase of the Product Life Cycle. Then from looking at the Sales Promotion table (this can be found in the Player’s Manual and Market Information Report), we can see that our ideal Sales Promotion Mix for a new Sports product is:

  • Trade Shows: 20%
  • Sales Force Training: 30%
  • Premiums (Gifts): 20%
  • Website and Social Media: 15%
  • Point of Purchase Displays: 15%
  • Rebates: 0%

Total =100%

That was a simple example, but what happens in the second year that we sell this Sports product? The product will have moved from the “Growth” phase to “Growth – Starting to Mature.” So the optimal Sales Promotion mix will be 1/3 of the way between the ideal Growth and Mature in the Sales Promotion table. That would give us an optimal Sales Promotion mix something like:

  • Trade Shows: 15%

(Ideal Growth = 20%, Ideal Mature = 5%)

  • Sales Force Training: 27%

(Ideal Growth = 30%, Ideal Mature = 20%)

  • Premiums (Gifts): 26%

(Ideal Growth = 20%, Ideal Mature = 40%)

  • Website and Social Media: 13%

(Ideal Growth = 15%, Ideal Mature = 10%)

  • Point of Purchase Displays: 17%

(Ideal Growth =15%, Ideal Mature =20%)

  • Rebates: 2%

(Ideal Growth = 0%, Ideal Mature = 5%)

Total =100%

Tip: You should buy the Distribution Coverage and Sales Promotion Market Research
report for detailed information on the Sales Promotion Rating and stage of Product
Life Cycle for all firms in the Industry.

Related Articles
How to set retail price and margin in Music2Go Marketing Simulation

Question of the Week: How do I set the Retail Price and Retailer Margin for each product? | Music2Go Marketing Simulation

Setting your Retail Price

When setting the Retail Price, you should consider things like:

  • How much competition is there in this market segment?
  • How are my competitors pricing their products in this market segment?
  • How sensitive is this market segment to price? What are the minimum and maximum price levels for this market?

Note: We recommend staying away from the top 5%-10% of the price range for every market segment, even for price insensitive segments. The maximum price is the level beyond which NO consumers will buy your products. So even for price insensitive segments, a product that is priced at the maximum looks like poor value compared to a more reasonably priced product.

Similarly do not price too close to the minimum price level for a given market. The extra market share is unlikely to make up for your smaller margins. Start off somewhere in the upper-middle of the price range and work your way up or down from there.

  • What is my overall strategy?
    • High Price, Lower Volume
    • Medium Price, Medium Volume
    • Low Price, Higher Volume
  • What are my projected sales for a given pricing level and advertising mix?

Setting your Retail Margin

Once you set your price, consider your retailer margin, unit cost, unit margin and sales projections. Look carefully at your Forecast Results reports and your Forecast Net Marketing Contribution report.

  • If your sales projections are accurate, will you make sufficient gross margin to give you a positive Net Marketing Contribution?
  • Is it worth giving your Distributors more Retail Margin early in the simulation to encourage them to stock your products and gain market share?
  • Or do you already have sufficient market share and distribution that you can afford to cut your Retail Margins?
Need extra help?
  • You can receive an immediate answer to a number of commonly asked questions through our Support Center.
  • Contact us here.
Check out other Music2Go Marketing articles here: 

Music2Go Tip: Leftover Marketing Budget

Music2Go Tip: Improving Total Marketing Contribution


Consumer Preferences and Shopping Habits of customers

What Do My Customers Want?

If you want to create messages that resonate with your audience, you need to know what they care about.

– Nate Elliott, Marketing Technology Adviser

Consumer Preferences

It is crucial that your Product Strategy follow the preferences of your consumers. Valuable Market Research has been conducted to investigate what your customers are looking for in the products they buy. This information is available to you under the Market Information Report (under the Key Reports menu).

Market Information Report with information on Product Dimension Sensitivities and Preferences in MikesBikes Intro

The table above (taken from the Market Information Report) will tell you important areas that you should be focusing on.

For example, the Mountain Segment has High sensitivity to Advertising. What this means is you should be focusing your Marketing Budget on Advertising and not PR (as the Mountain segment has low sensitivity in this area). If a market segment is highly sensitive to one area this means: “if you increase this figure, then proportionately more people are going to buy your bike.” This would then result in a higher return on your investment than if you invest in areas where your target market segment has a low sensitivity in.

Each market segment is sensitive to different dimensions. View the Market Segment Scenario Information report.

Marketing Dimension Sensitivities

If we take the Racers segment we see it has a low sensitivity to Advertising and a high sensitivity to PR. This means that an increase to our Racers bikes’ PR index (see Market Summary report) is going to have a larger increase to our sales volume than a change to our Awareness rating.

Questions?

We strongly recommend all MikesBikes Advanced users view our Business Simulation Tutorial Videos.

If you have any questions just send us an email through our Contact Us page.

Pricing your products correctly - Smartsims

How Do I Price My Products?

The Importance of Retail Price

The moment you make a mistake in pricing, you’re eating into your reputation or your profits.” – Katherine Paine

Your Retail Price is the dollar price you direct distributors (Bike Shops) to sell your products to customers. The distributor receives a percentage of the Retail Price (known as Retail Margin) and you receive the remaining amount (known as Wholesale Price).

Retail Price is usually a key determinant of Consumer Demand and is critical to maximizing your Sales Revenue and Profit. Therefore, carefully thinking about your pricing strategy is important to your company’s overall success!

The most common Pricing Methods are:

  1. Mark-up: Fixed margin on costs
  2. Target Return: Return/margin required by the company
  3. Perceived Value: What the consumer is willing to pay
  4. Going Rate: What is being charged in the market

Your Retail Price should not be set without regard for the price sensitivity of consumers (see Market Information Report) and the prices of your competitor’s products (see Market Summary Report).

Your Retail Price must also align with the overall marketing and company strategy. For example a Low Retail Price would require a High Volume of Unit Sales, as such, you would need to consider how this would impact marketing expenditure and operations decisions (i.e. Factory Capacity and Efficiency).

Pricing Example in our MikesBikes Introduction to Business Simulation:

Pricing Example in our MikesBikes Advanced Strategic Management Simulation:

Pricing Example in our Music2Go Marketing Simulation:

Questions?

If you have any questions just send us an email through our Contact Us page.