Business Simulation Hints Tips Cheats Archives

Sample Reports

Question of the Week: Why do our Awareness and PR Indexes fall even when we spend more? | MikesBikes Business Simulation

Consumers can only recall a certain amount of Branding, Advertising and Public Relations (PR) messages they see. So a given amount of advertising spend, for example, becomes less effective as the total amount of advertising viewed by consumers increases.

Imagine you are the only competitor in the market and you spend $5 million on Advertising or PR. You will probably get excellent coverage, a high proportion of consumers will remember your production, and you will have high advertising or PR indexes.

Now, imagine you are one of the five competitors in the market, each of whom is spending $5 million on Advertising. Although you might reach the same number of consumers as before, they are now being bombarded with five times the amount of advertising. This is confusing, so fewer consumers will remember your products and your indexes may fall (i.e. your advertising spend is now less effective due to the large amount of “noise” that consumers have to put up with.)

The same effect applies if your competitors start spending more. Say there are five products in a segment and you are spending $4 million, and your competitors are spending $1 million each. You will probably have relatively high indexes as you are providing $4 million out of the total $8 million advertising spend.

Now imagine you keep your spend at $4 million, but your competitors increase their spend to $5 million each. You are now providing only $4 million out of a total $24 million spend and consumers are receiving three times as much advertising in total as they were previously. So again, a lower proportion of consumers will remember your products and your indexes may fall from their earlier levels.

Related Articles:

Customer Relationship Management in AdSim Advertising Simulation

Three periods into the simulation and you will be given control of your firm’s Customer Relationship Management strategy. Customer Relationship Management or CRM is an approach to manage a company’s interaction with current and potential customers.

The purpose of a Customer Relationship Management strategy in the AdSim Advertising Simulation is to decide which policies you will implement to try and keep Existing Customers loyal to your brand.


In AdSim you are required to make decisions about four elements of your Customer Relationship Management strategy:

  • CRM SYSTEM

Decide whether or not you want to invest in a Customer Relationship Management database system? And if so what type? Entry level, Mid-Level or Custom Built.

  • WARRANTY

What length of Warranty that you want to offer your customers? 90 Days, 180 Days, One Year or Two Years.

  • SUPPORT

What level of a customer service do you want to provide? A manual, a knowledge base, Support Center, SmartCare.

  • LOYALTY

What type of customer loyalty program do you want to administer? A regular newsletter, a photo contest, video contest.

You are required to choose which option you think best targets your customers within your budgetary constraints.


You will be able to measure the effectiveness of your Customer Relationship Management strategy through the Market Demand report and the Market Survey of Customer Needs. These are available on the CRM decision screen.


Related Articles:

Measuring Your Firm’s Success in MikesBikes Business Simulation

Your Objective

Your objective is to create wealth for shareholders and so you will be evaluated on the cumulative change in Shareholder Value that your firm generates.

To see the shareholder value of your firm choose the “Financial Results for All Firms” report from the Key Reports menu.

Being evaluated on shareholder wealth is significantly different from evaluation based on net profit, market share, or earnings per share.

Your Aim

You should aim to:

  • Maximize net profit
  • Minimize shareholder investment
  • Minimize risk (associated with high levels of debt)

Due to these multiple objectives, a small niche marketer consistently earning good margins and without much debt may outperform a large heavily-indebted firm with earnings several times greater.

Firms will need to carefully consider these objectives when developing their overall strategy, their marketing, operational and financial plans. Simply increasing in size will not necessarily lead to an increase in shareholder value. You should only invest money (for example in new plant, new product development, or on factory improvements) if you believe that the return on these investments will be greater than what shareholders could achieve elsewhere at the same level of risk (e.g. shareholders can earn returns of 8% by investing in a term deposit). If not, you should instead consider repaying debt, paying a dividend, or repurchasing issued shares.

For more detail on how shareholder value is calculated and how to improve this, see the How to Increase Shareholder Value article.

Staff Salary, Training and Motivation level

MikesBikes Advanced Question of the Week: What happens if you invest in people and they leave?

Invest in developing your people in MikesBikes
By Peter Baeklund

Good people will stay longer, are more motivated and will work harder if you provide them with an opportunity to learn, and grow.

Some people will choose comfort and security, even if they’re not fully engaged with their jobs. This is both bad for them and for you.

According to current research, opportunity for growth and development are still two of the most powerful motivators.

Your business is nothing more than the collective energy and efforts of the people working with and for you. 

If you want to make your business better, invest in your people. They’ll get the job done.

Jim Bouchard

So what does this mean for you in MikesBikes?

Not sufficiently investing in training your staff, poorly paid workers and/or firing workers due to inaccurate capacity calculation will often result in a low skill and motivation index. In addition, another negative outcome of this is an increase in staff turnover rate, which means your products’ quality will also suffer.

So what should you do to ensure that your staff are highly motivated?

1. Pay your staff well

Workers are more motivated when they are paid well.

The average salary level you set will affect not only your bottom line, but also worker motivation and effectiveness. Factory workers are paid (on average) the rate you select. Administration staff are paid (on average) twice the rate. For comparison purposes, the average industry salary is $25,000 per year.

The graph below shows the motivation index achieved by changing the firm’s average salary from $25,000. The effect would be increased by sustaining the salary changes across succeeding years.

2. Train your staff 

You need to think carefully about the relationship between your overall strategy and how employee motivation and employee skill levels relate to that, especially if your strategy is to be a low cost, high volume manufacturer.

In general, well trained and motivated workers are more productive than poorly trained workers, so you need to employ fewer workers to achieve a given level of worker capacity. If your workers are well trained and motivated you need fewer Administration staff.

Well trained workers are a significant factor in improving your internal quality. Workers are more motivated when they are paid more and when they are well trained. They are less motivated when you fire other workers as their feeling of job security decreases.

The graph below shows the effect of job cuts on morale and staff turnover rate.

Poorly motivated and poorly trained workers can contribute to significant staff
turnover (sometimes as high as 40% to 50% per year). That gets expensive because each worker than is replaced costs $4,000 to replace. Also each new  worker arrives with a minimum level of training, so your average employee skill level is reduced which lowers your internal quality. So remember to maintain an appropriate balance in managing your workforce rather than using a ‘slave labor’ model even if your overall strategy is to be a low cost manufacturer.

3. Pay close attention to your workforce

Keep track of your staff’s Skill Index, Motivation Index and the Staff Turnover Rate by referring to the Manufacturing Quality Report every rollover. You can find this report in the Manufacturing menu > Reports tab and navigate down to the report.

Manufacturing Quality Report MikesBikes

Related Articles:


What is Weighted Average in MikesBikes?

MikesBikes Question of the Week: What does “Weighted Average” mean?

Market Summary Report in MikesBikes

It is the average Price / Awareness / PR / Distribution / Quality index weighted by the volume of demand for each product.

We use a weighted average to give a better indication of the overall level of value for consumers.

For instance, if you have two products A and B with A priced at $100 and B at $50, then the average price of those two products is $75, ie. ($100 + $50) / 2 = $75).

But for the weighted average we look at the amount of demand for each product.

If A had 100 units of demand and B had ten times as much demand (1,000 units) then the weighted average price would then be:

(100 * $100 per unit + 1000 * $50 per unit) / 1100 units = $54.55

Related Articles


Distribution in MikesBikes

Making Distribution Decisions in the MikesBikes Business Simulation

What is Distribution?

Distribution (place) relates to the ability of the firm to make products accessible to its target segments. This is achieved through distribution channels – in this case through retail outlets.

The number of stores in the channel that decide to stock your products will depend on the retail price, margin, unit sales history, and extra support offered. You must specify what margin and what extra support you are going to offer the retailers in each channel.

What is Retail Margin and Extra Support ($)?

The retailer margin decision refers to the percentage of the retail price that the retailer keeps.  So don’t increase it too much! Example, if your bike is priced at $1,000 and your retail margin is 40%, then the wholesale price that you receive for each bike is only $600.

Maintaining existing distributors and acquiring new ones require considerable resources. Extra Support  (e.g. in terms of special promotions and discounts) costs are required to enable product training of retailers and providing promotional literature.

Distribution costs vary based on the number of stores that currently stock your products.

Distribution and Branding screen in MikesBikes Advanced

Vendors of bikes can be broken into three categories:

  • Bike Shops
  • Department Stores
  • Sports Stores

(Note: Sports Stores are only available in Multi-Player in MikesBikes Advanced)

Your challenge is to decide how to set price and distributor retail margins in order to influence your distribution coverage in a way that results in either increased market share or increased profit.

Distribution Index

Your distributors look at how much total retail margin they make from stocking all of your products and based on this they decide how many stores will stock your products. This then translates into a Distribution Index which ranges from 0 to 1 (higher is better). In general as your distributors make more money from selling your products, then more stores will stock them and your Distribution Index will increase.

Distribution Index in MikesBikes

Example of Distributor Behavior

Note: The market segments all have medium sensitivity to Distribution apart from the Commuter segment, which has low sensitivity to distribution (see the Market Information report under the Key Reports menu).

For instance, if you sold 10,000 bikes at $1000 with a 50% retail margin, then your distributors would make 10,000 * 50% * $1000 = $5 million

Perhaps you dropped your price to $900, and your retail margin to 45% you can now sell 12,000 units. Your distributors would then make 12,000 * 45% * $900 = $4.86 million

In this case, your Distribution Index would fall slightly as your distributors made less retail margin in total. This may not be an issue in the Commuter market, but it may disadvantage you in the other market segments. Of course, it also depends on your competitors’ actions. If your competitors have much higher distribution indexes than you, then you will lose more market share.

As you can see, sales volume is also an important component of distribution. So it may be beneficial to keep retail margins slightly higher whilst building initial market share for new products. It may be possible to gradually reduce margins once you have established products with high sales volumes without adversely affecting your Distribution Index.

Related Articles:
Music2Go Inventory Costs

Question of the Week: What are the Inventory Costs in Music2Go Marketing Simulation?

There are two types of inventory costs in Music2Go.

Inventory Holding Cost

Each year all firms are charged 3.5% of the value of their average closing inventory for inventory holding costs to cover the cost of warehousing etc.

For instance, if you have 1 million units of unsold stock at the end of the year at a cost of $40 per unit, then you have $40 million of inventory which will cost:

3.5% *$40 million = $1.4m in holding cost

Inventory Disposal Loss

If a firm updates a product with a new design or abandons it altogether then all existing inventory is dumped at 93.5% of what the firm paid for it.

Example:

$1 million of inventory would be dumped for $935K giving a loss of $65K.

You can gather some valuable market research from looking at the figures for your competitors. Firms that have no inventory holding costs have stocked out, because they are under forecasting demand for their products. Firms with large inventories are over forecasting demand. If you see any inventory disposal costs, then you know that your competitor has either updated an existing product’s design or abandoned one.

Related Articles:

How to Set Retailer Price and Retailer Margin in Music2Go

Improving Total Marketing Contribution

Need extra help?
  • You can receive an immediate answer to a number of commonly asked questions through our Support Center.
  • Contact us here.

Reference: 

This Photo by Unknown Author is licensed under CC BY

AdSim Marketing Plan Budget Report

ADSIM ADVERTISING SIMULATION REPORT GUIDE: Budget Report

What is the Budget Report?

The budget report shows you your annual budget, how this is currently being spent and how much budget is remaining. You can access this report by clicking on the Live Forecast widget (top right of all decision screens), on your Home page and under the Reports menu.

Related: Industry Benchmark Report

Need extra help?

  • You can receive an immediate answer to a number of commonly asked questions through our Support Center.
  • Contact us here.
AdSim Advertising Simulation by Smartsims Industry Benchmark Report

AdSim Advertising Simulation Report Guide: Industry Benchmark Report

The Industry Benchmark Report is a summary of all firms’ key results so you can benchmark yourself against your competitors. Click on the image below for an example report:

The Sales Revenue listed for each is the total wholesale sales revenue for each company’s products.

The Cost of Goods Sold is the number of units of a particular product sold multiplied by its manufacturing cost.

Gross Margin is the amount of profit that each firm made after the manufacturing costs were deducted.

Note: You have no control over either the wholesale price or the manufacturing cost of your product, so your aim to maximize sales revenue by running the most cost effective advertising campaign that you can.

The Evaluation Research expenditure lets you know how much market research your competitors are purchasing.

The Agency Fees let you know whether your competitors are using an Agency or not and how much it is costing them.

The Media Advertising expenditure allows you to see how much money your competitors are spending on Advertising, but now how they are allocating it to each media type.

Marketing Contribution is the amount of profit remaining after manufacturing (cost of goods sold) and marketing expenditures have been deducted. This is a measure of how profitable your firm is as a result of your decisions.

Need more help?

  • You can receive an immediate answer to a number of commonly asked questions through our Support Center.
  • Contact us here.

MikesBikes Introduction Report Guide: Market Summary

What is the Market Summary Report?

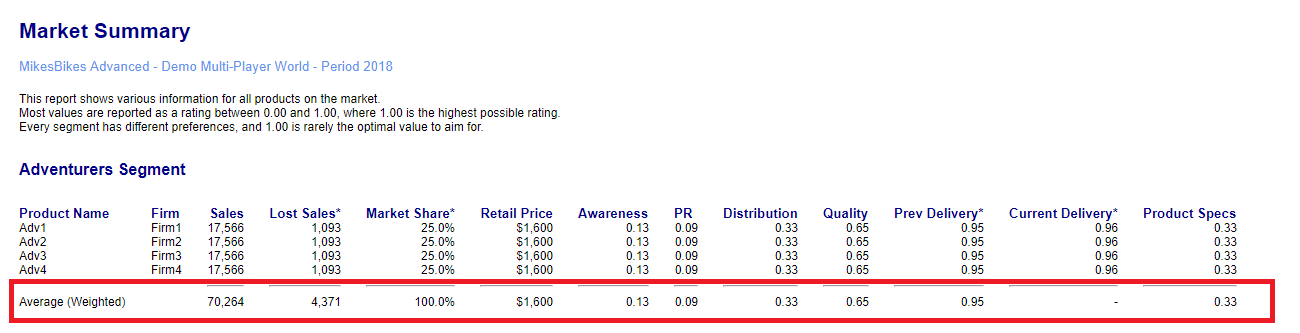
The Market Summary Report gives a side-by-side comparison of all the products currently being sold in the market. It compares every product on the key features that help consumers decide which product to buy.

MikesBikes Introduction Market Summary Report

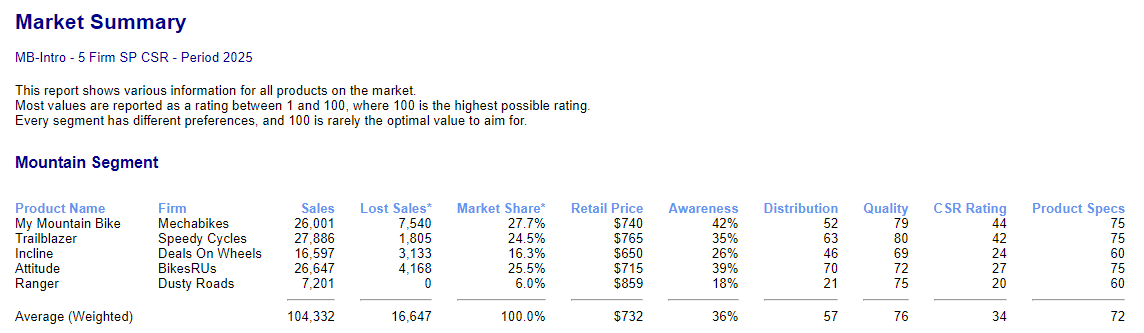
Some of these features are more important than others to each Market Segment. For instance, the Road segment is highly sensitive to Quality and Product Specifications, but does not care as much about Price. But the Kids segment is highly sensitive to Price and Awareness but does not care much about Quality. So you need a different strategy to succeed in each market.

You should read the Market Research report to see which features are most important to each Market Segment.

Sales, Lost Sales, and Market Share

Sales is simply how many units that each product sold last year.

Lost Sales tells you how many more units each product would have sold if that Firm had manufactured enough to satisfy demand. If Lost Sales is zero for a given product, then the Firm produced enough to meet all the demand for that product this year.

Example: If there are 20,000 units of demand for a product, and 18,000 units available for sale,
then Lost Sales = 2000 units

Market Share shows the share that each product has of total market demand (ie. including Lost Sales).

Retail Price

Retail Price is the recommended retail price that each firm sets for their product(s). So if your Retail Price is $700 and your average retailer margin is 35%, then the wholesale price that you receive from your distributors for each bike is $455. But the Retail Price is what consumers actually pay, so Retail Price is what they compare when deciding which product to purchase.

Awareness

Awareness % is a measure of how many consumers in each market segment remember and know something about your product due to your brand promotion and product advertising.

Awareness of 50% means that 50% of the consumers in that segment are aware of your product. When trying to raise the awareness level of your product(s), you need to pay attention to making sure that you are targeting your budgets to the media types that each market segment watches the most.
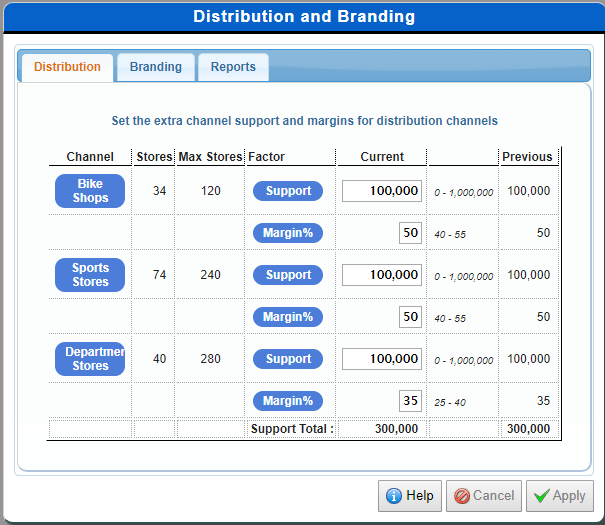
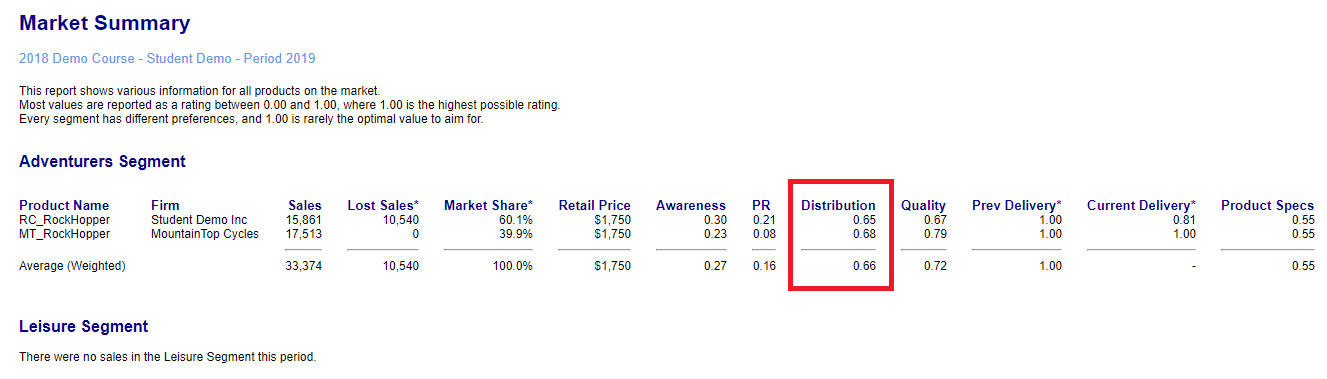
Distribution

The Distribution Rating (1 to 100) is a measure of what proportion of the consumers in each market segment can easily find your products at a local store without having to travel too far.

In general, as your sales volumes and retail margins increase then more stores will be willing to stock your products and your Distribution Rating will increase. Once you have established significant sales volume in a market you may be able to reduce your retail margins slightly without losing too many stores.
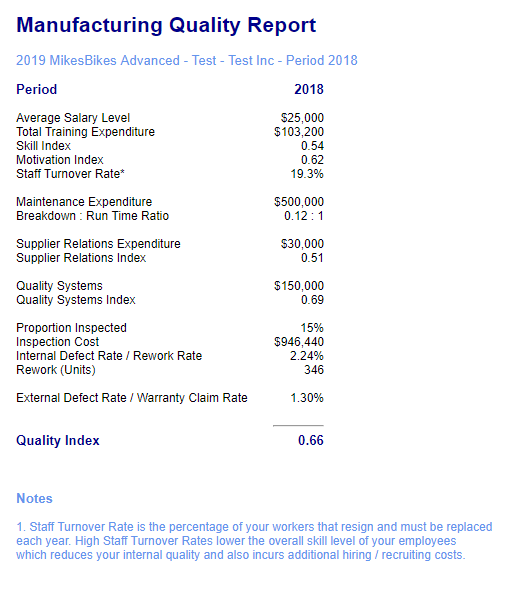
Quality

Quality refers to the level of customer satisfaction in your product based on finish, workmanship, and the rate of product defects. This is measured using a Quality Rating out of 100 which applies to all your company’s products.

See the Quality screen under the Operations menu.

Product Specs

The Product Spec Rating is a measure from 1 to 100 of how close your product is to a perfect or ideal bike for that Market segment. From Year 4 onwards you will be able to conduct Product Development to improve the specifications of your bikes and Cost Reduction to reduce the Prime Cost of your bikes.

CSR Rating (Corporate Social Responsibility)

Corporate Social Responsibility (CSR) is a concept which sees companies being responsible not only for profit maximization, but also to do what’s best for people, the planet and society at large. Your CSR rating is a measure of how well your company integrates social and environmental concerns with its business operations.

Your CSR Rating is affected by your Social Responsibility decisions (under Brand Promotion from Year 2) and Sustainable Manufacturing decisions (under Operations from Year 3).

Note: If you do not see the CSR Rating, then your course is not using the Brand Promotion and Sustainable Manufacturing decisions.

Comparing Product Ratings

Don’t get too obsessed with trying to achieve a specific Awareness, Distribution, Quality, or Product Spec Rating. The important thing is to use the Market Summary report as a benchmarking tool to see how your products compare with your competitors.

If your competitors have a much cheaper product, or much higher product specs or quality than you then you may need to invest more in those areas to compete. But if you already have significantly higher Quality or Awareness than your competitors then at some point diminishing returns will kick in and you may be better investing more into other areas of your business.

Also remember to read the Market Research report to see which features are most important to each Market Segment so you aren’t wasting time and money on something which won’t really make much difference to a particular market.