Business Simulation Hints Tips Cheats Archives

MikesBikes Intro Report Guide - Industry Benchmark Report

MikesBikes Introduction Report Guide: Industry Benchmark Report

What is the Industry Benchmark Report?

This report is a summary of all firms’ Key Financial results, which you can use to benchmark yourself against your competitors.

In MikesBikes Introduction, this report is divided into four sections: Financial Results, Customer Satisfaction, Internal Results and Innovation Learning.

Financial Results

MikesBikes Intro Financial Results

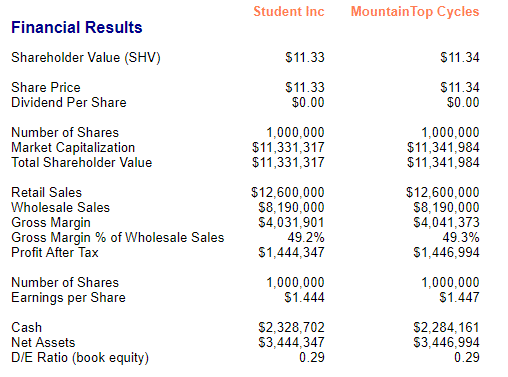
There are two key variables that you need to understand in this section, Share Price and Shareholder Value.

Your Share Price is the current market price of one share in your firm; the main drivers of share price are your average earnings per share (EPS) and your D/E ratio. If you want to improve your Share Price then you need to keep improving your EPS and to keep your D/E ratio below 1.0.

Shareholder Value is a measure of how much value a shareholder has received from owning one share of your company from the moment you took over running your firm. So Shareholder value is the current Share Price, plus the accumulated dividends that you have paid with 10% compound interest.

Customer Satisfaction

Customer Satisfaction in MikesBikes Intro 
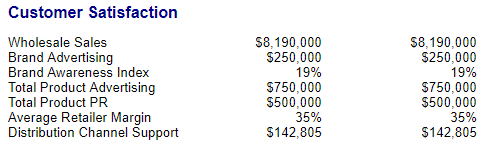
Most of the fields here should be self-explanatory. However, you need to be aware that the Distribution Channel support figures include both your Extra Support (sales promotion support) spending and the annual support cost of supporting all the retailers that currently stock your products. Distribution Information (Distribution and Branding > Reports tab) report details what those annual costs are.

So every firm that has at least one store stocking its products will be spending at least a couple of hundred dollars. To see what their sales promotion budgets are, view the Multi-Firm Retailer Margins and Extra Support report under “Firm Marketing”.

Internal Results

Internal Results in Mikesbikes intro

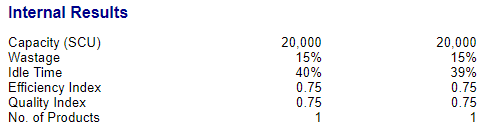
The main purpose of this section of the report is so that you can compare your production efficiency strategy with your competitors. Make sure to compare your wastage results and number of products. The lower the production efficiency budget and the higher the number of products (more setup time), then the worse a firm’s wastage value will be.

Innovation and Learning

Innovation and Learning in Mikesbikes intro

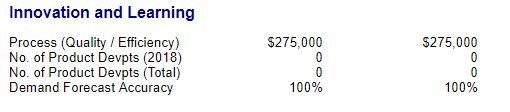
Monitor how much your competitor(s) are spending on product development, it means that they are either making their products cheaper to produce, more attractive to the market or both. If you let a competitor get a significant production cost advantage over you then they will easily win any price wars involving that product.

Need extra help?

Check out the Smartsims Support Center or contact us here.

Testing Decisions in MikesBikes

How do I Test My Decisions in MikesBikes Introduction to Business Simulation?

There are three ways on how you can test your decisions in MikesBikes Introduction to Business Simulation.

1. Live Forecast

The figures on the Live Forecast update in real-time as you click “Apply” on any decision screen. This enables you to easily see the impact of individual decision changes on overall performance.

The figures can then be clicked to bring up the relevant forecast report in full. Previous figures remain in small font below.

The new Live Forecast feature will help you make more informed decisions and provide an immediate warning if you have made poor decisions.

2. Forecast Results Reports

MikesBikes Forecast Results Reports

This menu features reports which give you an indication of your performance – assuming you meet your forecasts.

There are a range of Pro Forma reports available for you to view:

  • Forecast Results Report Overview
  • Pro Forma Income Statement
  • Pro Forma Product Gross Margin Report
  • Pro Forma Cost of Goods Manufactured Report
  • Pro Forma Cashflow Report

3. Offline Mode

This feature in the Multi-Player allows you to try out different decision options and strategies before you commit yourself.

In Offline Mode, your competitors use only their default decisions. So don’t read too
much into the results.

To start Offline Mode, click the “Offline” button next to the Multi-Player launch button.

In Offline Mode, your competitors use only their default decisions. So don’t read too much into the results. For instance, in Offline Mode you might launch new products into empty markets and do very well due to lack of competition. But if you use those same decisions in the Multi-Player, you could do poorly if the other firms choose to launch new products at the same time. So always think about what might happen if your competitors were to do something differently.

Important: After using Offline Mode, your team’s agreed decisions need to be re-entered in the Multi-Player.

Watch our tutorial video here:


Note that this feature might be disabled in your course.

Need extra help?
  • You can receive an immediate answer to a number of commonly asked questions through our Support Center.
  • Contact us here.
salary-in-mikesbikes-advanced

Question of the Week: How much should we pay our staff?

This question relates to our MikesBikes Advanced Strategic Management Simulation.

Human Resources: Average Salary

This is the average annual earnings of an employee working on the factory floor. The average salary level you set will affect not only your bottom line but also attract better skills and will improve motivation.

Factory workers are paid (on average) the rate you select. Administration staff are paid (on average) twice this rate. For comparison purposes, the average industry salary is $25,000 per year.

How does Salary impact your staff’s motivation level?

Salary level is compared to an industry average of $25,000 and smoothed over several years.

Job security is reduced during downsizing, but is also smoothed over several years.

Including the training/skill level reflects the fact that employees are looking for more than salary and job security. They are looking for a job where they are learning and working with other highly-skilled people.

The graph below shows the motivation index achieved by changing the firm’s average salary from $25,000. The effect would be increased by sustaining the salary change across succeeding years.

Staff Motivation and Turnover Rate in MikesBikes Advanced

The graph below shows the effect of job cuts on morale and staff turnover.

Staff Motivation and Turnover Rate when Downsizing in MikesBikes Advanced

Check out the latest Question of the Week articles here:
preventative-maintenance-mikesbikes

Question of the Week: What is Preventative Maintenance? | MikesBikes Advanced Business Simulation

Preventative Maintenance

You should decide on the total amount to spend on Preventative Maintenance. This is an aggregate amount and so should be varied when a firm changes its plant capacity.

You should look at the Manufacturing Responsiveness Report (under the Key Reports menu) and if you are losing a significant amount of time to Breakdowns, then consider increasing your spend on Preventative Maintenance.

Effects of Spending in Preventative Maintenance

MikesBikes Advanced Breakdown Curve

Expenditure on preventative maintenance has a number of effects. Preventative maintenance reduces the likelihood of plant breakdown and losses in capacity caused by these delays. Adequate maintenance also serves to maintain the resale value of plant. Finally, ensuring the plant is producing within tolerances contributes towards the reduction of defects and improves your internal quality.

Example: Currently your firm has approximately 25,000 SCU of plant. If it were new it would be worth $4 million. However it is a few years old and its book value is only $1.6 million, so about 7% of its potential is lost due to breakdowns.

Maintenance Index vs Accumulated Maintenance in MikesBikes Advanced

Investment of about $24 per SCU or $600,000/year in preventative maintenance is sufficient to offset deterioration and will keep its operational level (and hence resale) value constant at its current level. Higher investment than this will increase the level accumulated maintenance and hence decrease machine breakdowns. Remember to adjust the amount you spend on maintenance as you increase or decrease your plant size.


Check out the latest Question of the Week articles here:


Investor Relations in MikesBikes Advanced

Question of the Week: What is Investor Relations?

Investor Relations Decision in MikesBikes Advanced decision screen

More than a mathematical analysis of risks and returns determines the value of a share. It is also affected by how much the investment community knows and understands about the company concerned, and their perceptions of the quality of the firm’s management.

Hence to ensure that their shares are fairly valued, firms need to make every effort to ensure that investors and their advisors have recent frequent clear information about the firm’s situation and plans. The larger and more complex the firm, the more effort is required.

Investor Relations (Investor PR) Index

The Investor Relations (also known as Investor PR) index essentially acts as a multiplier on your company’s share price. So for a very simple example, if your Investor PR index is 1.1, then your Share price will be 10% higher than if your Investor PR index is 1.0 (assuming no other changes). In practice, by spending on Investor PR you will reduce your profit, which will be a drag on your share price, so the effect isn’t quite as simple as that.

Investor Relations MikesBikes Advanced S Curve

In general, the larger your company, the more you need to spend to get a higher PR index. The maximum PR index possible is around 1.2, and you have to spend more and more to raise your index the closer you get to that limit.

How much should we invest in Investor PR?

Your best guide to how much to spend on Investor PR is to look at your current Investor PR index and spend, then decide how much more you are willing to spend on it to try to boost it. Keep in mind that if you spend too much on Investor Relations you may depress your Share Price by reducing your profit and earnings per share. Also decide whether or not there is another better use for the money spent on Investor Relations such as on Product Development.

View other Question of the Week articles here:

What Does Awareness Index Mean and How Do You Influence It? 

How Do We Decrease Our Factory’s Wastage? 

How Do We Increase Our Delivery Rate? 


Consumer Preferences and Shopping Habits of customers

What Do My Customers Want?

If you want to create messages that resonate with your audience, you need to know what they care about.

– Nate Elliott, Marketing Technology Adviser

Consumer Preferences

It is crucial that your Product Strategy follow the preferences of your consumers. Valuable Market Research has been conducted to investigate what your customers are looking for in the products they buy. This information is available to you under the Market Information Report (under the Key Reports menu).

Market Information Report with information on Product Dimension Sensitivities and Preferences in MikesBikes Intro

The table above (taken from the Market Information Report) will tell you important areas that you should be focusing on.

For example, the Mountain Segment has High sensitivity to Advertising. What this means is you should be focusing your Marketing Budget on Advertising and not PR (as the Mountain segment has low sensitivity in this area). If a market segment is highly sensitive to one area this means: “if you increase this figure, then proportionately more people are going to buy your bike.” This would then result in a higher return on your investment than if you invest in areas where your target market segment has a low sensitivity in.

Each market segment is sensitive to different dimensions. View the Market Segment Scenario Information report.

Marketing Dimension Sensitivities

If we take the Racers segment we see it has a low sensitivity to Advertising and a high sensitivity to PR. This means that an increase to our Racers bikes’ PR index (see Market Summary report) is going to have a larger increase to our sales volume than a change to our Awareness rating.

Questions?

We strongly recommend all MikesBikes Advanced users view our Business Simulation Tutorial Videos.

If you have any questions just send us an email through our Contact Us page.

Product Development in MikesBikes

Why Did My Product Development Fail? | MikesBikes Advanced Business Management Simulation

Two reasons why your project failed:

1. The project/budget expenditure was too low and/or;
2. The requested unit prime cost was unrealistically low

As in real life, you do not want to commit to a product development project without checking that it was appropriately funded and that it would be able to provide an acceptable return on investment.

In addition, you have to be careful that the specifications you enter for your new product actually fall close to the ideal point of the segment you are targeting. Look under Reports for Perceptual Map of Market Segments to check this. Products outside the radius of influence (i.e. outside the circles) will not sell at all.

How do we conduct successful development projects?

We will walk you through an example where we develop the design for a Racers bike. While the specifics and calculations may change, the steps you follow will be the same:

1. View the Indicative Values for Market Segments within the Product Development Scenario Information report to view the ideal product attribute levels desired by each segment. (Note: These desired product attributes by each market segment change slightly from year to year so be sure to keep monitoring for the changes.)

Indicative Values for Market Segments

2. Take the current Style/Tech Specs of your closest existing Design Project and calculate the required change in Style/Design and Technical Specs.

In our example, the closest existing Design Project is our Adventurer Bike. You can view the Product Development Project Results Report to view your closest existing design paying attention to the Style/Design and Technical Specs:

Product Development Project Results Report

3. Calculate the difference in Style and Technical Specifications between the desired design and the closest existing design.

As you can see, in this example, our only and closest existing design project is our Adventurer product. This features specifications of 50 Style and 60 Technical. Our desired design project has targeted specifications of 20 Style and 86 Technical.

So the difference is 30 Style and 26 Technical.

Estimated Costs and Time Frames

We can see on the Product Development Scenario Information report that each unit of Style development costs $1000 and each unit of Technical development costs $20,000.

Our example calculation will be:

30 x $1,000 added to 26 x $20,000 = $550,000

Therefore, our design cost would be $550,000 on the new design to achieve 20 Style and 86 echnical.

4. Calculate your prime cost.

From the table above we can see that the prime cost will be calculated at roughly $0.1 to $0.15 per design and $4.50 to $5.00 per technical specification. We want a racers bike with 20 style/design and 86 technical specifications.

A conservative calculation would therefore be:

0.15 x 20 added to 5.00 x 86 = $433

If we enter any additional expenditure on to our design cost this will be used to further reduce the Prime Cost.

Note: This does NOT mean you should always aim super low with target Prime Cost.  If you aim too low, then your project won’t have enough money to achieve its objectives and you will miss your style / tech spec targets as well as your prime cost target.

How do I correct a failed product design?

A failed product design is a design that shows anything less than 100% success rate within the Product Development Results Report. Unfortunately this means you will need to design the design again. However! The failed design is likely to be a lot closer to your desired specifications than the previous closest design, thus it means it is likely to be cheaper to invest in. Simply follow the process above again working off the new closest existing design (even if the closest existing design is a failure).

Questions?

We strongly recommend all MikesBikes Advanced users view our Business Simulation Tutorial Videos.

If you have any questions just send us an email through our Contact Us page.

Making Operations Decisions in MikesBikes Intro

How to Make Operations Decisions in MikesBikes Introduction

There are three Operations decisions that you make in the MikesBikes Introduction to Business Simulation; Factory Capacity, Efficiency and Quality.

Factory Capacity

You will be able to control your Factory Capacity in Year 2 of the simulation. Your Factory Capacity is measured in Standard Capacity Units (SCU). Your Factory’s total SCU will determine how many bikes you can produce. For example, the standard Mountain bike requires 0.5 SCU to produce one bike. So if your Factory Capacity was 20,000 SCU, you would be able to produce 40,000 bikes.

You should look to increase Factory Capacity when you expect sales of your Mountain Bike to increase, and also when you launch new products. You should look to decrease Factory Capacity if you have excess Factory Idle Time, usually caused by lower sales than expected.

Factory Efficiency

Wastage during production of your bikes is caused by time spent on setting up machinery, maintenance and breakdowns. These act as a constraint on productivity by absorbing a proportion of your Factory’s available production capacity. The Efficiency decision in MikesBikes determines the amount to be spent on reducing Wastage. The more that you can decrease Wastage, the more of your Factory Capacity will be available for production.

Important: A larger Factory will require a greater amount spent on Efficiency. Therefore, when you increase the size of your Factory, through the Capacity Planner, you will also need to increase Efficiency expenditure to maintain your existing Efficiency level.

efficiency chart

Factory Quality

Your Factory’s quality systems will determine the build quality of your products. This is reflected in the Quality Index which can be tracked on the Market Summary report.

Quality is a key driver of demand for some of the market segments in your industry (see Market Information report). If you have a product in these markets, expenditure in Quality will be important to develop a competitive product.

Important:  A larger Factory will require a greater amount spent on Quality Systems. Therefore, when you increase the size of your Factory, through the Capacity Planner, you will also need to increase Quality expenditure to maintain your existing Quality Index.

Quality chart

Questions?

If you have any questions just send us an email through our Contact Us page.

How do I conduct a Sales Forecast in MikesBikes?

What is a Sales Forecast?

A Sales Forecast is a prediction of the number of units you believe you can sell in the year ahead. It is not what you want to sell, but rather, how many unit sales are likely based on market size and actual demand.

Accurate sales forecasting is essential to succeeding in the MikesBikes Business Simulation. This will enable you to project future sales revenue and profitability. Get it too wrong and you will end up with excess stock on hand which will cost your company in holding fees. However, don’t expect perfection as it will always be an estimate.

How do I conduct a Sales Forecast in MikesBikes?

The videos below will demonstrate the best approach to forecast how many units you may sell in the year ahead.

MikesBikes Introduction

MikesBikes Advanced

Questions?

If you have any questions just send us an email through our Contact Us page.

Pricing your products correctly - Smartsims

How Do I Price My Products?

The Importance of Retail Price

The moment you make a mistake in pricing, you’re eating into your reputation or your profits.” – Katherine Paine

Your Retail Price is the dollar price you direct distributors (Bike Shops) to sell your products to customers. The distributor receives a percentage of the Retail Price (known as Retail Margin) and you receive the remaining amount (known as Wholesale Price).

Retail Price is usually a key determinant of Consumer Demand and is critical to maximizing your Sales Revenue and Profit. Therefore, carefully thinking about your pricing strategy is important to your company’s overall success!

The most common Pricing Methods are:

  1. Mark-up: Fixed margin on costs
  2. Target Return: Return/margin required by the company
  3. Perceived Value: What the consumer is willing to pay
  4. Going Rate: What is being charged in the market

Your Retail Price should not be set without regard for the price sensitivity of consumers (see Market Information Report) and the prices of your competitor’s products (see Market Summary Report).

Your Retail Price must also align with the overall marketing and company strategy. For example a Low Retail Price would require a High Volume of Unit Sales, as such, you would need to consider how this would impact marketing expenditure and operations decisions (i.e. Factory Capacity and Efficiency).

Pricing Example in our MikesBikes Introduction to Business Simulation:

Pricing Example in our MikesBikes Advanced Strategic Management Simulation:

Pricing Example in our Music2Go Marketing Simulation:

Questions?

If you have any questions just send us an email through our Contact Us page.