What is the Industry Benchmark Report?
This report is a summary of all firms’ Key Financial results, which you can use to benchmark yourself against your competitors.
In MikesBikes Introduction, this report is divided into four sections: Financial Results, Customer Satisfaction, Internal Results and Innovation Learning.
Financial Results

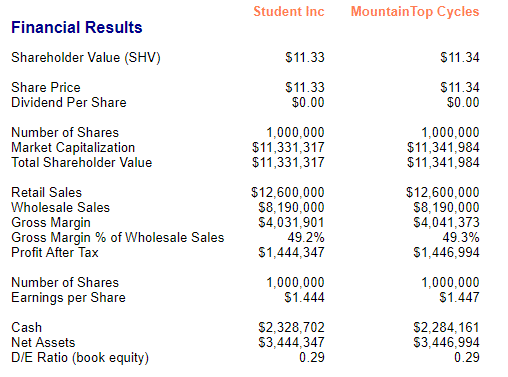
There are two key variables that you need to understand in this section, Share Price and Shareholder Value.
Your Share Price is the current market price of one share in your firm; the main drivers of share price are your average earnings per share (EPS) and your D/E ratio. If you want to improve your Share Price then you need to keep improving your EPS and to keep your D/E ratio below 1.0.
Shareholder Value is a measure of how much value a shareholder has received from owning one share of your company from the moment you took over running your firm. So Shareholder value is the current Share Price, plus the accumulated dividends that you have paid with 10% compound interest.
Customer Satisfaction
 Most of the fields here should be self-explanatory. However, you need to be aware that the Distribution Channel support figures include both your Extra Support (sales promotion support) spending and the annual support cost of supporting all the retailers that currently stock your products. Distribution Information (Distribution and Branding > Reports tab) report details what those annual costs are.
So every firm that has at least one store stocking its products will be spending at least a couple of hundred dollars. To see what their sales promotion budgets are, view the Multi-Firm Retailer Margins and Extra Support report under “Firm Marketing”.
Internal Results

The main purpose of this section of the report is so that you can compare your production efficiency strategy with your competitors. Make sure to compare your wastage results and number of products. The lower the production efficiency budget and the higher the number of products (more setup time), then the worse a firm’s wastage value will be.
Innovation and Learning

Monitor how much your competitor(s) are spending on product development, it means that they are either making their products cheaper to produce, more attractive to the market or both. If you let a competitor get a significant production cost advantage over you then they will easily win any price wars involving that product.
Need extra help?
Check out the Smartsims Support Center or contact us here.
