You should decide on the total amount to spend on Preventative Maintenance. This is an aggregate amount and so should be varied when a firm changes its plant capacity.
You should look at the Manufacturing Responsiveness Report (under the Key Reports menu) and if you are losing a significant amount of time to Breakdowns, then consider increasing your spend on Preventative Maintenance.
Effects of Spending in Preventative Maintenance
Expenditure on preventative maintenance has a number of effects. Preventative maintenance reduces the likelihood of plant breakdown and losses in capacity caused by these delays. Adequate maintenance also serves to maintain the resale value of plant. Finally, ensuring the plant is producing within tolerances contributes towards the reduction of defects and improves your internal quality.
Example: Currently your firm has approximately 25,000 SCU of plant. If it were new it would be worth $4 million. However it is a few years old and its book value is only $1.6 million, so about 7% of its potential is lost due to breakdowns.
Investment of about $24 per SCU or $600,000/year in preventative maintenance is sufficient to offset deterioration and will keep its operational level (and hence resale) value constant at its current level. Higher investment than this will increase the level accumulated maintenance and hence decrease machine breakdowns. Remember to adjust the amount you spend on maintenance as you increase or decrease your plant size.
Check out the latest Question of the Week articles here:
More than a mathematical analysis of risks and returns determines the value of a share. It is also affected by how much the investment community knows and understands about the company concerned, and their perceptions of the quality of the firm’s management.
Hence to ensure that their shares are fairly valued, firms need to make every effort to ensure that investors and their advisors have recent frequent clear information about the firm’s situation and plans. The larger and more complex the firm, the more effort is required.
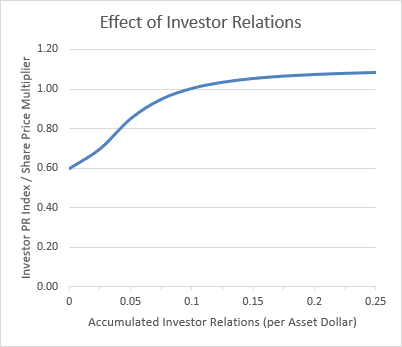
Investor Relations (Investor PR) Index
The Investor Relations (also known as Investor PR) index essentially acts as a multiplier on your company’s share price. So for a very simple example, if your Investor PR index is 1.1, then your Share price will be 10% higher than if your Investor PR index is 1.0 (assuming no other changes). In practice, by spending on Investor PR you will reduce your profit, which will be a drag on your share price, so the effect isn’t quite as simple as that.
In general, the larger your company, the more you need to spend to get a higher PR index. The maximum PR index possible is around 1.2, and you have to spend more and more to raise your index the closer you get to that limit.
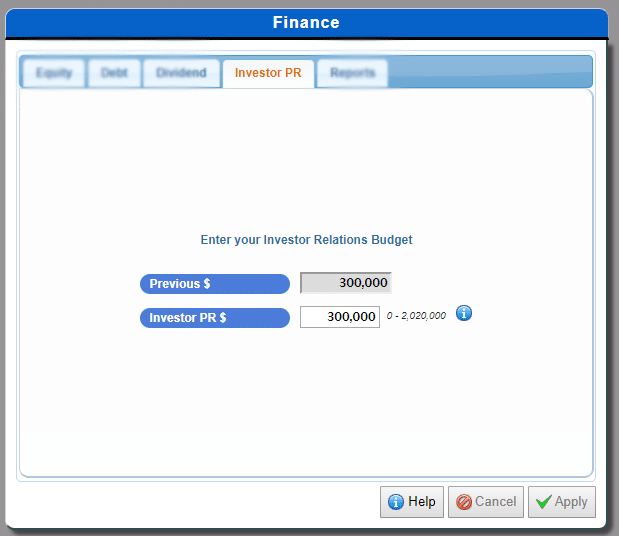
How much should we invest in Investor PR?
Your best guide to how much to spend on Investor PR is to look at your current Investor PR index and spend, then decide how much more you are willing to spend on it to try to boost it. Keep in mind that if you spend too much on Investor Relations you may depress your Share Price by reducing your profit and earnings per share. Also decide whether or not there is another better use for the money spent on Investor Relations such as on Product Development.
“If you want to create messages that resonate with your audience, you need to know what they care about.”
– Nate Elliott, Marketing Technology Adviser
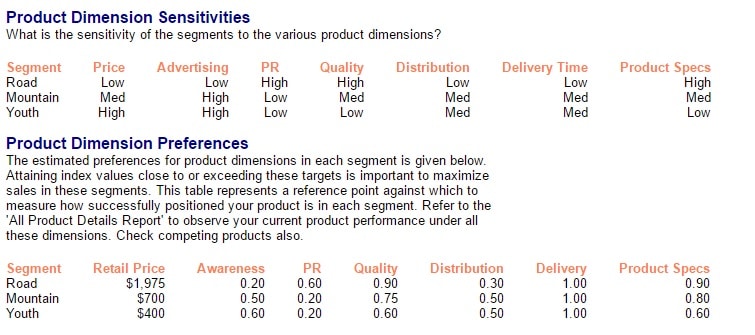
Consumer Preferences
It is crucial that your Product Strategy follow the preferences of your consumers. Valuable Market Research has been conducted to investigate what your customers are looking for in the products they buy. This information is available to you under the Market Information Report (under the Key Reports menu).
The table above (taken from the Market Information Report) will tell you important areas that you should be focusing on.
For example, the Mountain Segment has High sensitivity to Advertising. What this means is you should be focusing your Marketing Budget on Advertising and not PR (as the Mountain segment has low sensitivity in this area). If a market segment is highly sensitive to one area this means: “if you increase this figure, then proportionately more people are going to buy your bike.” This would then result in a higher return on your investment than if you invest in areas where your target market segment has a low sensitivity in.
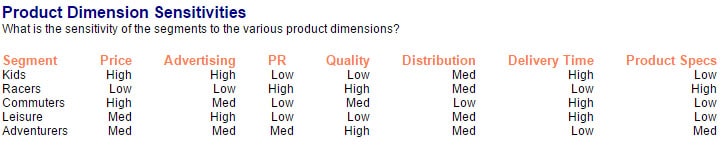
Each market segment is sensitive to different dimensions. View the Market Segment Scenario Information report.
If we take the Racers segment we see it has a low sensitivity to Advertising and a high sensitivity to PR. This means that an increase to our Racers bikes’ PR index (see Market Summary report) is going to have a larger increase to our sales volume than a change to our Awareness rating.
This live resource enables our simulation users to receive instant answers to their questions, as well as browse a wide range of help topics to guide them through their learning journey.
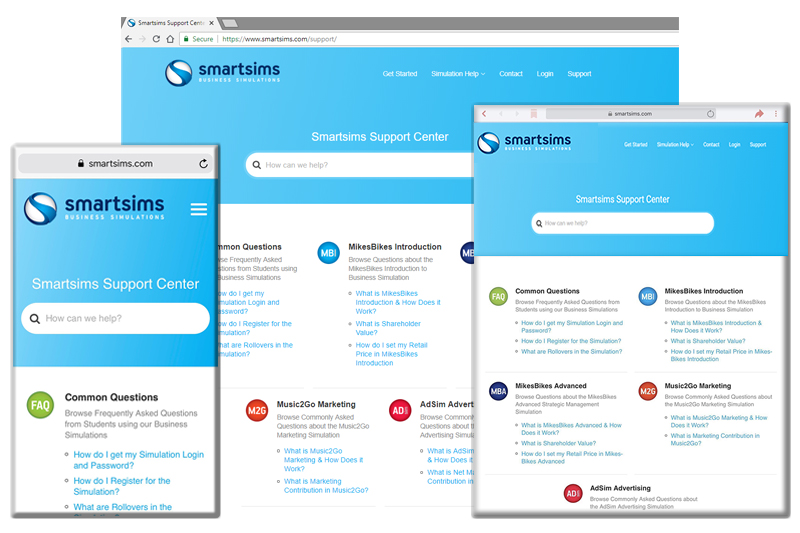
The Smartsims Support Center works on any device:
Browse decision areas such as Marketing, Operations, Finance; or specific decision periods:
And users can share their feedback on the help articles, enabling us to continue to improve content available through the knowledge-base:
1. The project/budget expenditure was too low and/or; 2. The requested unit prime cost was unrealistically low
As in real life, you do not want to commit to a product development project without checking that it was appropriately funded and that it would be able to provide an acceptable return on investment.
In addition, you have to be careful that the specifications you enter for your new product actually fall close to the ideal point of the segment you are targeting. Look under Reports for Perceptual Map of Market Segments to check this. Products outside the radius of influence (i.e. outside the circles) will not sell at all.
How do we conduct successful development projects?
We will walk you through an example where we develop the design for a Racers bike. While the specifics and calculations may change, the steps you follow will be the same:
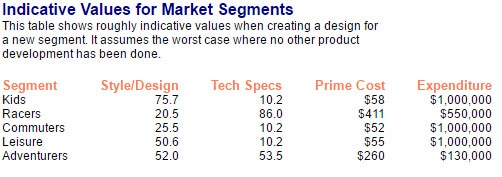
1. View the Indicative Values for Market Segments within the Product Development Scenario Information report to view the ideal product attribute levels desired by each segment. (Note: These desired product attributes by each market segment change slightly from year to year so be sure to keep monitoring for the changes.)
2. Take the current Style/Tech Specs of your closest existing Design Project and calculate the required change in Style/Design and Technical Specs.
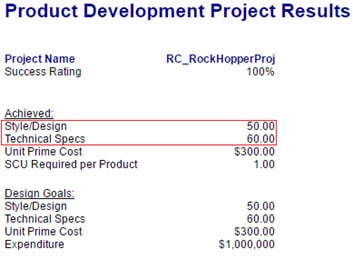
In our example, the closest existing Design Project is our Adventurer Bike. You can view the Product Development Project Results Report to view your closest existing design paying attention to the Style/Design and Technical Specs:
3. Calculate the difference in Style and Technical Specifications between the desired design and the closest existing design.
As you can see, in this example, our only and closest existing design project is our Adventurer product. This features specifications of 50 Style and 60 Technical. Our desired design project has targeted specifications of 20 Style and 86 Technical.
So the difference is 30 Style and 26 Technical.
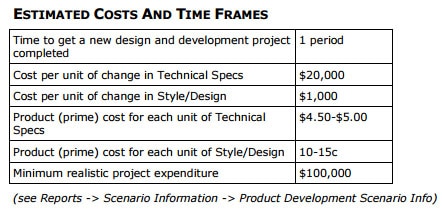
We can see on the Product Development Scenario Information report that each unit of Style development costs $1000 and each unit of Technical development costs $20,000.
Our example calculation will be:
30 x $1,000 added to 26 x $20,000 = $550,000
Therefore, our design cost would be $550,000 on the new design to achieve 20 Style and 86 echnical.
4. Calculate your prime cost.
From the table above we can see that the prime cost will be calculated at roughly $0.1 to $0.15 per design and $4.50 to $5.00 per technical specification. We want a racers bike with 20 style/design and 86 technical specifications.
A conservative calculation would therefore be:
0.15 x 20 added to 5.00 x 86 = $433
If we enter any additional expenditure on to our design cost this will be used to further reduce the Prime Cost.
Note:This does NOT mean you should always aim super low with target Prime Cost. If you aim too low, then your project won’t have enough money to achieve its objectives and you will miss your style / tech spec targets as well as your prime cost target.
How do I correct a failed product design?
A failed product design is a design that shows anything less than 100% success rate within the Product Development Results Report. Unfortunately this means you will need to design the design again. However! The failed design is likely to be a lot closer to your desired specifications than the previous closest design, thus it means it is likely to be cheaper to invest in. Simply follow the process above again working off the new closest existing design (even if the closest existing design is a failure).
There are three Operations decisions that you make in the MikesBikes Introduction to Business Simulation; Factory Capacity, Efficiency and Quality.
Factory Capacity
You will be able to control your Factory Capacity in Year 2 of the simulation. Your Factory Capacity is measured in Standard Capacity Units (SCU). Your Factory’s total SCU will determine how many bikes you can produce. For example, the standard Mountain bike requires 0.5 SCU to produce one bike. So if your Factory Capacity was 20,000 SCU, you would be able to produce 40,000 bikes.
You should look to increase Factory Capacity when you expect sales of your Mountain Bike to increase, and also when you launch new products. You should look to decrease Factory Capacity if you have excess Factory Idle Time, usually caused by lower sales than expected.
Factory Efficiency
Wastage during production of your bikes is caused by time spent on setting up machinery, maintenance and breakdowns. These act as a constraint on productivity by absorbing a proportion of your Factory’s available production capacity. The Efficiency decision in MikesBikes determines the amount to be spent on reducing Wastage. The more that you can decrease Wastage, the more of your Factory Capacity will be available for production.
Important: A larger Factory will require a greater amount spent on Efficiency. Therefore, when you increase the size of your Factory, through the Capacity Planner, you will also need to increase Efficiency expenditure to maintain your existing Efficiency level.
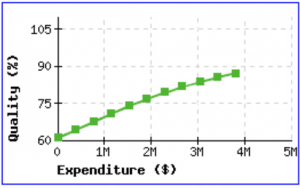
Factory Quality
Your Factory’s quality systems will determine the build quality of your products. This is reflected in the Quality Index which can be tracked on the Market Summary report.
Quality is a key driver of demand for some of the market segments in your industry (see Market Information report). If you have a product in these markets, expenditure in Quality will be important to develop a competitive product.
Important: A larger Factory will require a greater amount spent on Quality Systems. Therefore, when you increase the size of your Factory, through the Capacity Planner, you will also need to increase Quality expenditure to maintain your existing Quality Index.
Questions?
If you have any questions just send us an email through our Contact Us page.
A Sales Forecast is a prediction of the number of units you believe you can sell in the year ahead. It is not what you want to sell, but rather, how many unit sales are likely based on market size and actual demand.
Accurate sales forecasting is essential to succeeding in the MikesBikes Business Simulation. This will enable you to project future sales revenue and profitability. Get it too wrong and you will end up with excess stock on hand which will cost your company in holding fees. However, don’t expect perfection as it will always be an estimate.
How do I conduct a Sales Forecast in MikesBikes?
The videos below will demonstrate the best approach to forecast how many units you may sell in the year ahead.
MikesBikes Introduction
MikesBikes Advanced
Questions?
If you have any questions just send us an email through our Contact Us page.
“The moment you make a mistake in pricing, you’re eating into your reputation or your profits.” – Katherine Paine
Your Retail Price is the dollar price you direct distributors (Bike Shops) to sell your products to customers. The distributor receives a percentage of the Retail Price (known as Retail Margin) and you receive the remaining amount (known as Wholesale Price).
Retail Price is usually a key determinant of Consumer Demand and is critical to maximizing your Sales Revenue and Profit. Therefore, carefully thinking about your pricing strategy is important to your company’s overall success!
The most common Pricing Methods are:
Mark-up: Fixed margin on costs
Target Return: Return/margin required by the company
Perceived Value: What the consumer is willing to pay
Going Rate: What is being charged in the market
Your Retail Price should not be set without regard for the price sensitivity of consumers (see Market Information Report) and the prices of your competitor’s products (see Market Summary Report).
Your Retail Price must also align with the overall marketing and company strategy. For example a Low Retail Price would require a High Volume of Unit Sales, as such, you would need to consider how this would impact marketing expenditure and operations decisions (i.e. Factory Capacity and Efficiency).
Pricing Example in our MikesBikes Introduction to Business Simulation:
Pricing Example in our MikesBikes Advanced Strategic Management Simulation:
Pricing Example in our Music2Go Marketing Simulation:
Questions?
If you have any questions just send us an email through our Contact Us page.
Henry Ford is known for his innovative assembly line and American-made cars . Like many, he wasn’t an overnight success. His early businesses failed and left him broke five times before he founded the now successful Ford Motor Company. As they say,
Remember that life’s greatest lessons are usually learned at the worst times and from the worst mistakes.
Over the years, we have noticed the three common mistakes that students make in MikesBikes Intro and we want you to learn from these and how you can resolve them.
Three of the most common mistakes in MikesBikes Intro are:
Misunderstanding the Importance of Pricing Products Correctly
Inaccurate Sales Forecasts
Ineffective Spending in Operations
Mistake#1: Misunderstanding the Importance of Pricing Products Correctly
As Katherine Paine said, “The moment you make a mistake in pricing, you’re eating into your reputation or your profits.”
Price is usually a key determinant of demand and is the most critical component to maximizing your revenue. Therefore, carefully thinking about your Pricing strategy is important as this would have an impact on the demand for your products.
With a poor pricing strategy, you will be missing out on profits in every transaction that you make. View the “Market Summary Report”, in comparison to your competitors does your product have low Awareness, low Quality, low Distribution, or low Delivery (or all of the above)? If so you should price your product at the lower end of the market, if not and demand for your product is still average to high, then you can price your products at the higher end of the market. Keep in mind that extreme prices, high or low, will have a negative effect on Gross Margins.
There are several pricing methods, the most common of which are:
Mark-up: Fixed margin on costs
Target Return: Return/margin required by the company
Perceived Value: What the consumer is willing to pay
Going Rate: What is being charged in the market
These methods need to be in line with the overall marketing strategy. In addition, the retail price should be set by having regard for the price sensitivity of consumers and the prices of competitive products. This can be found in the Market Information Report (under the Key Reports menu).
Mistake# 2: Inaccurately Forecasting Sales
We have noticed two mistakes that students make in terms of forecasting sales:
Excessive Closing Inventory
Issues with Lost Sales due to lack of stock
Both of these scenarios are caused by inaccurately forecasting your firm’s sales for the year ahead. Ideally a firm would want to minimize this by correctly forecasting sales and adjusting your production based on this forecast (while also taking into account existing inventory levels).
There is a very helpful video available that demonstrates how to Forecast Sales within MikesBikes Introduction for new and existing products. Watch this here to learn how to Forecast your Sales accurately:
Mistake# 3: Ineffective Spending in Operations
Students often overspend or underspend in Operations and both have negative implications in their factory, its efficiency and the quality of their products.
There are three Operations decisions that you make in MikesBikes: Capacity, Efficiency and Quality.
Spending in these areas must be linked to your products and consumer preferences, some products require low Quality or high Delivery Time, whereas others revolve around Pricing and Advertising.
Capacity
Your Factory capacity is measured in Standard Capacity Units (SCU). The theoretical
capacity of a factory (in SCU) is calculated from the plant (machine) capacity and
the number and effectiveness of the workers.
For example, the standard Mountain bike requires 0.5 SCU to produce one
bike. If 500 SCU were available for production then the maximum output of
this design would be 500 SCU/0.5 SCU per unit = 1000 bikes (assuming zero idle
time and wastage).
Keep in mind that too much capacity relative to production/sales demand will result
in greater idle time (an inefficient use of resources causing higher average
manufacturing costs per bike). Also note that the maximum capacity you are able
to buy is set at the maximum amount of available cash you have for this year
before spending anything on any of your other budgets (decisions).
Capacity decisions should be made to accommodate your currently entered sales
forecasts and production decisions.
Efficiency
The Efficiency decision is used to enter the amount to be spent on reducing
wastage during production. Wastage relates to time spent on activities such as
setting up and maintenance of machines. In turn these activities act as a constraint
on production by absorbing a proportion (%) of the factory’s available capacity.
Note that increasing the size of your factory involves an increased Efficiency budget
to maintain your existing Efficiency level.
Quality
Quality refers to the satisfaction experienced by customers from a product and is an
important determinant of customer demand. It is measured in MikesBikes in terms
of the Quality Index which can be tracked on the Market Summary report.
Increasing the size of your factory involves an increased quality budget to maintain
your existing quality level. Before heavily investing in quality, consider your product
strategy as some segments are heavily sensitive to quality while others are not (if
you are planning to be a discount specialist then a large quality budget may be an
unnecessary expense, while if you are focusing on high end products they must be
produced to a high quality).
Conclusion
Every situation is unique within the simulation and these are only recommendations based on common mistakes we have found. As such there are no generalizations but this article will provide you with the tools to diagnose your unique situation and correct any problems you may be facing.
If you have any questions or would like to discuss anything further from what has been mentioned, please feel free to get in touch with us by clicking here.