Student Advice Archives

What is a double rollover in MikesBikes Advanced and how does it work?

If you are using MikesBikes Advanced your course will most likely feature a Final Double Rollover.

What is a Double Rollover?

A double rollover means that the simulation will rollover twice simultaneously. A Final Double Rollover ensures your final decisions leave their company in a healthy position for long-term success.

How should I plan for the Double Rollover?

You only need to enter your decisions once before the Final Double Rollover. All decisions will then be processed for the first rollover. For the second rollover most of your decisions will simply repeat, except for the following decisions which will not carry over:

  • Hire/Fire Workers
  • Buy/Sell Plant
  • Raise/Repurchase Equity
  • Raise/Repay Long-Term Debt
  • Product Development Decisions
  • Takeover and Owned Company Decisions (if applicable)

If you have any questions please contact us.

MikesBikes Intro Hall of Famer, Joe Powell

Interview with the Top Hall of Fame Student: Joe Powell

Joe Powell from Des Moines Area Community College (DMACC) managed to land the #1 spot in the MikesBikes Introduction Hall of Fame!

Joe took the Introduction to Business course taught by Professor Josh Daines over at DMACC. He’s a 41 year old student and a father of 4 returning for a degree in Business Administration. He just graduated a degree in General Studies and got to share the experience of receiving his diploma alongside his wife and daughter in the same ceremony (see photo above). He is now currently working on his second degree.

He never won anything, except for an English contest when he was in 4th grade and a Renaissance Festival tickets last year, but now he managed to successfully land the Top position in the MikesBikes Intro Hall of Fame. This is such an incredible achievement!

We have interviewed Joe to learn about his journey on how he managed to achieve the top spot in the Hall of Fame, his experience and advice to future students.

Smartsims: What is your decision making process within the simulation?

Joe: This is actually the toughest question, I think, that you could ask. My decision making process started out simple, but as the rollovers continued, other factors began influencing my decisions. The first couple rollovers were straightforward: based on the advertising arc, which investments paid off the best? Then the additional product lines, how would the competition respond, what was the best allocation of funds outside of the advertising arc, etc.

Smartsims: What was your strategy going into the simulation?

Joe: I wanted to jump out to an early advantage, allocating funds where they would make the highest return. I wanted to maintain high revenues, high cash-on-hand, and minimize lost sales. I also figured the other firms would implement similar strategies, so I needed to be flexible yet maintain consistent growth. Once I began doubling my SHV every rollover, I focused more on my firm’s progress projections and less on the competition.

Smartsims: How did you begin implementing that strategy?

Joe: I knew the minimum SHV numbers that I wanted to hit at each rollover. I would run practice sim after practice sim until I found the right combination to get to that number. Once I did, I ran more sims to see if I could improve on it. Sometimes it worked, sometimes I made myself frustrated.

Smartsims: How did you familiarize yourself with the simulation?

Joe: I started by opening it up and trying everything. At the beginning of the semester, I did single-player simulations and failed spectacularly. I learned a little here and there, and with the help of some professors at DMACC, I was able to get a grasp on the program.

Smartsims: How would you describe the competition?

Joe: The competition was fun, above all else. The other firms made strategy implementation vital because I just didn’t know what they would do. It was a lot more fun with real people playing instead of just a computer with predictable moves.

Smartsims: What resources did you pull on to develop your winning strategy which led you to be a part of the MikesBikes Introduction Hall of Fame?

Joe: I utilized the Single-Player format first. After about a dozen practices, I had a solid opening strategy. I also talked to MikesBikes guru, DMACC’s own Professor Zarr as well as my Business teacher, Professor Daines, and asked a few questions. Without pointers from them, I wouldn’t have reached the numbers I did. I studied the interviews of previous winners, played around with different strategies, even ran rollovers where all I did was change a few dollars here or there to learn where the benchmarks were. I created my own spreadsheet that helped keep track of money allocations, allowing me to look back on what worked and what didn’t.

Smartsims: What challenges did you face? How did you overcome these?

Joe: At first, my numbers were right where I wanted them. Then, I started getting lost sales and I couldn’t figure out why. My numbers were exactly where I wanted them, and the results should have been predictable. I turned to the offline mode, and it was a life-saver. I strongly suggest anyone in multi-player competitions use the offline mode. It will not predict your opponents’ moves, but it will help you figure out your own.

Smartsims: Was there anything in particular you did that you think helped to prepare yourself?

Joe: I obsessed over this simulation. It wasn’t healthy. I talked about it, I played it, I thought of new strategies while walking around Disney World. My kids rolled their eyes when I would bring it up.

Smartsims: How has participating within a course which uses a business simulation to supplement their teaching materials helped you? What do you think of the business simulation?

Joe: I really liked the sim as part of the curriculum. I mentioned that to the professor during the class review. Learning about the Advertising Mix as well as the Promotion Mix helped understand the importance of allocating funds to specific areas within the sim. Studying it, then putting it into direct action was really a cool experience. I really enjoyed having Mike’s Bikes as part of the class.

Buy and sell capacity in MikesBikes

Buying and Selling Plant Capacity in MikesBikes Advanced

Buying Plant Capacity

Plant can be purchased or sold each period in multiples of 10 SCUs. Each 10 SCU of plant costs $1,600 to buy and any new plant takes one period to be commissioned and become productive.

Selling Plant Capacity

Plant is depreciated in the annual accounts using the diminishing value method, at a rate of 20% per annum. It can also be sold at any time. However the selling price will depend upon the age of the plant, how well it has been maintained, and how much investment has been made into quality systems and setup time reduction upgrades.

If there is any difference between the actual selling price of plant and its book value then that will be reported in the accounts as either a loss or gain on sale. When plant is sold, you lose the use of that plant immediately.

Awareness Index in MikesBikes

Question of the Week: What does the Awareness Index mean and how do you influence it?

MikesBikes' Market Summary Report

The Awareness Index is the performance of your Advertising and Branding decisions.

To increase it, you should invest in Branding, increase your total Advertising expenditure, and improve your Advertising mix.

Branding

Investing in promoting your firm’s brand will enhance the awareness of all your products. Brand advertising is a valuable complement to your individual product advertising – especially if you have several products.

About half of your brand awareness will carry over from the previous period. The curve below shows the increase in brand awareness (on top of what is carried over) achieved by various levels of expenditure.

branding graph

Advertising Mix

Your Advertising mix is how your Advertising budget is allocated across the three media channels (TV, Internet and Magazines). To improve this, you will need to identify which channels your customers view the most (see Market Information report).

Below are steps on how you can develop an effective Advertising Mix.

How to develop an Advertising Mix:

There are three substantial resources that you can use to determine your optimal advertising mix for a given advertising spend. One is through the Advertising and PR Reach by Media curve, the Product Dimension Sensitivities and lastly the Media Viewing Habits table. All of these can be found within the Market Information Report.

Each media type can reach a given proportion of its audience for a given investment. This is shown within the Advertising and PR Reach by Media graph below.

Advertising and PR Reach Curve

As an example, let’s say we are developing an Advertising Mix for the Adventurer segment with a budget of $2 million.

Step 1: Identify the segment’s sensitivities

If we look at the Market Information Report, we will see in the Product Dimension Sensitivities that the Adventurers segment has Medium sensitivity in Advertising.

What these sensitivities mean is that a change in any of these factors will result in a proportionate change in the consumers’ demand for the product.

Product Dimension sensitivity information in MikesBikes

Step 2: Identify the segment’s Media Viewing Habits

You will need to consider your consumers’ viewing habits by referring to the Media Viewing Habits chart (below) to help you allocate your budget on each channel.

Media Viewing Habits

The table shows us that 40% of the Adventurers market watch TV, 30% engage within the use of the Internet regularly, and 50% read magazines and is the most prevalent media channel. You then use this information with the reach curves to calculate the percentage of the market segment you’re actually reaching.

Step 3: It’s now time to allocate our Advertising Budget!

We know that we have $2 million to spend on Advertising this Adventurer product directly. We know that 50% of this segment view magazines and 40% watch TV, but 30% are on the internet regularly. Also, while Adventurers segment mostly read magazines; the internet has a higher reach so we will look into investing in Internet and Magazines.

Advertising and PR Reach Curve. Allocated spend on Internet

If we spend $1 million on Internet, we will reach around 44% of the Internet Viewers. 30% of the Adventurer segment can be reached via Internet advertising, meaning we could reach approximately 30% x 44% = 13.2% of the Adventurer segment.

If we spend $1 million on Magazines, we will reach around 22% of the Magazine readers. 50% of the Adventurer segment can be reached via Magazine advertising, meaning we could reach approximately 22% x 50% = 10% of the Adventurer segment.

Together, our $2 million budget (half spent on Internet and half on Magazine) would reach approximately 23% of the Adventurer segment.

This is only an example. This is far from the best mix you can make. We suggest playing around on different Marketing Mixes and see what works best for your strategy and budget.

Have a Question of the Week suggestion? Send this to us here or message us on Facebook.

Stack of money.

External Funding Options in MikesBikes: Debt or Equity?

In MikesBikes, funding large investment options such as purchasing additional plant capacity and development projects may require additional capital. Raising Debt or Equity are ways companies can raise additional funds to finance these large projects or investments. In deciding whether to increase Debt, issue Shares or a combination of both; companies should assess their current situation and the impact of each financial decision. Continue reading External Funding Options in MikesBikes: Debt or Equity?

Don’t Make These Mistakes in the MikesBikes Advanced Business Simulation

“Success does not consist in never making mistakes, but in never making the same one a second time.”

–          George Bernard

Three of the most common mistakes we see MikesBikes Advanced users make are:

  1. Misunderstanding the Importance of Reaching the Right Customers
  2. Failed Development Projects
  3. Excessive Stock on Hand

Mistake#1: Misunderstanding the Importance of Reaching the Right Customers

Not understanding this can be a costly mistake as it often leads to incorrectly assigning your marketing mix. This can have a negative impact on the demand for your products and can also lead to overspending. Meaning your firm’s profitability is at risk!

How do you know if you are spending your marketing budget inefficiently? Follow through this section, it will show you how to efficiently allocate your marketing budget.

There are three aspects to a marketing budget within MikesBikes-Advanced:

  1. Branding
  2. Advertising
  3. PR

Each market segment is sensitive to different dimensions. View the Market Segment Scenario Information report.

Marketing Dimension Sensitivities

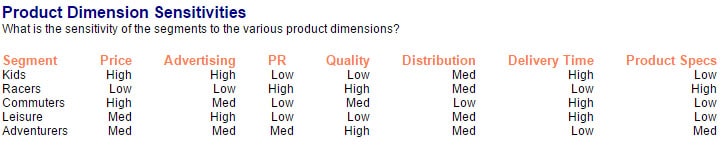
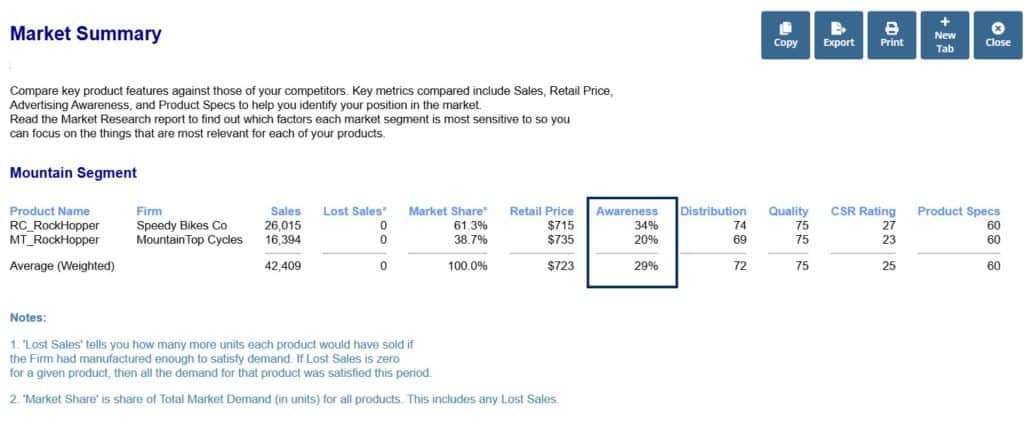
Branding and Advertising work together to improve your firm’s Awareness rating (see Market Summary) whereas your PR index is only influenced by PR spend. Branding promotes your firm’s brands and will influence all of your product’s awareness whereas advertising is product specific.

How do I interpret this Product Dimension Sensitivities graph?
The best way to explain it is through an example. If we take the Racers segment we see it has a low sensitivity to Advertising and a high sensitivity to PR. This means that an increase to our Racers bikes’ PR index (see Market Summary report) is going to have a larger increase to our sales volume than a change to our Awareness rating.

I’ve now chosen which dimensions of marketing I want to focus on, what next?
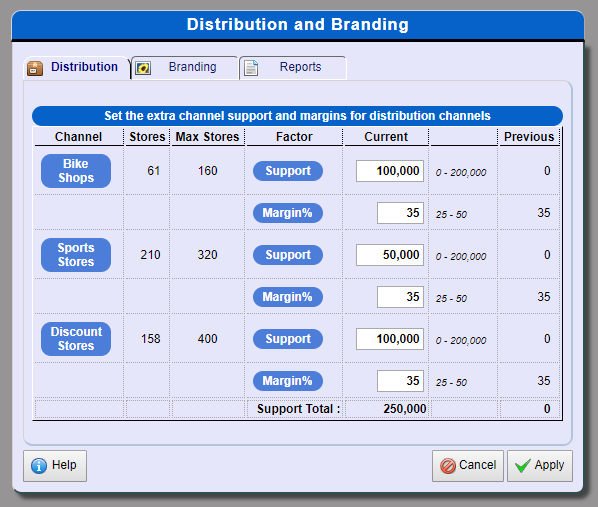
Branding impacts the awareness of every product you have and is valuable if you have several products within the market. This is a straight forward decision; simply enter in the amount you want to invest into branding.

Whereas Advertising and PR decisions require you to choose media channels based upon the media types’ reach and the media viewing habits of each market segment. There are three media choices to develop your marketing mix on: Television, Internet and Magazines.

There are two substantial sources of information you can use to determine your optimal advertising mix for a given advertising spend.

Each media type can reach a given proportion of its audience for a given investment. This is shown within the Advertising and PR Reach by Media graph below (this can be found within the Market Segment Scenario Information report).

Advertising and PR Reach by Media Graph

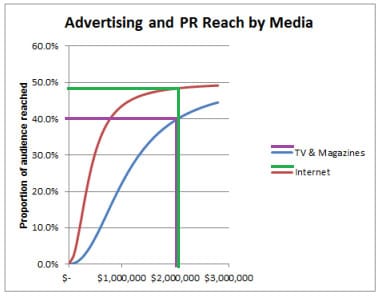
The best way to explain this would be to provide an example. A $2 million spent on TV or Magazine advertising (purple line) could reach around 40% of the potential TV or Magazine audience. Whereas $2 million spend on Internet advertising (green line) could reach 49% of potential Internet audience.

However, you also have to consider who uses each media channel. This is where we look at the Media Viewing Habits:

Media Viewing Habits Table

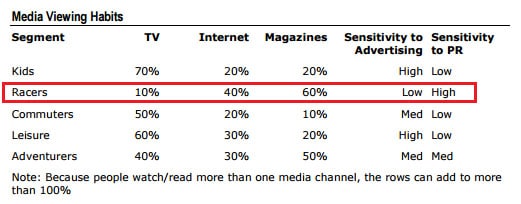
The table shows us that 10% of the Racers market watch TV, 40% engage within the use of the Internet regularly, and 60% read magazines. You use this information with the reach curves to calculate the percentage of the market segment you’re actually reaching.

Okay. I get that, but how do I tell if my MikesBikes-Advanced marketing budget is ineffective?

We have prepared for you two examples. One is a bad example of a marketing spend and the other is a good example. Through these examples this article will walk you through how to calculate an effective spend.

Bad example:

“I have a $2 million budget. I see most people read magazines in the Racers Market and they’re sensitive to PR so I’m going to spend this $2 million on magazines within the Racers market”

 Sound logical, right? No. Far from it.

It is correct that the Racers segment is highly sensitive to PR. It is also correct that 60% of the Racers segment read magazines however it is ignoring the effective reach of each media type. Let’s look at the audience reached and calculate this ‘real reach’ for this bad marketing expenditure:

Media reach curve with point in graph pointed out

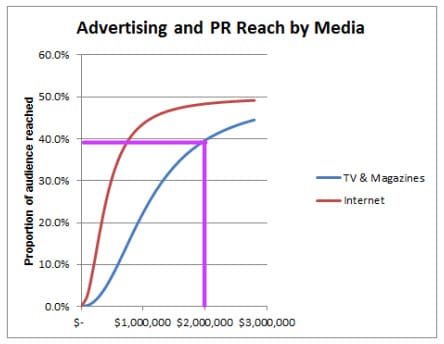
From the above curve we can see that a $2 million spend on magazines would reach approximately 38%.  60% of the Racers segment read magazines regularly. So our $2 million spend would reach 38% x 60% = 22.8%

So from that example, you might think that it’s best to allocate your budget completely on Magazines, but if we come up with a good Marketing Mix, we might be able to do better.

Good Example:

“I’ve got $2 million to spend on marketing this Racers product directly. I see the Racers market is sensitive to changes in PR so I’m going to fund my marketing budget into PR for this bike. I also see that 60% of this segment view magazines but 40% are on the internet regularly. Also, while racers segment mostly reads magazines; the internet has a higher reach so I will look into investing in both.”

Let’s look at how this logic plays out.

Media Reach Curve Good logic

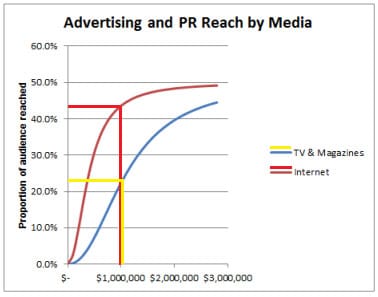
If we spend $1 million on Internet, we could reach approximately 44% of Internet viewers. 40% of the Racers segment is reachable via Internet advertising, meaning we could reach approximately 40% x 44% = 17.6% of the Racer segment.

Also spending $1 million on Magazines, we could reach approximately 23% of Magazine Viewers. So we could reach approximately 23% x 60% = 13.8% of the Racer segment.

Together, our $2 million budget (half spent on Internet and half on Magazine) would reach approximately 31.4% of the Racer segment. This is clearly a better use of our PR budget than bad example given which only reached 22.8% of the Racers segment.

As you can see, with the same budget, but a different allocation towards each media channel can make a huge difference in the amount of consumers you can reach.

This is only an example of good and bad marketing mixes. This is far from the best mix you can make. We suggest playing around on different Marketing Mix and see what works best for your strategy and budget.

Mistake#2: Failed Product Development Projects

You want to get product development projects right the first time as this can be a costly mistake. It can mean either your Unit Prime Cost is higher than you want and/or your specifications are not as you wanted resulting in a lower demand for your product if they are wrong.

Why did my project development fail and how do I fix it?

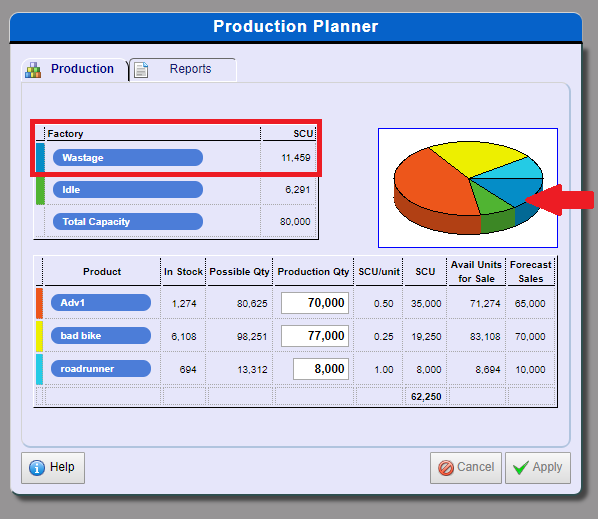
Mistake#3: Excessive Closing Inventory

Too much inventory can cause cost your firm in Finished Goods Holding Cost, this can be a needless cost if you are able to predict next year’s demand more accurately.

There are two ways on how you can resolve this:

  1. Start by making Accurate Sales Forecast based on last year’s Actual Sales and adjust production based on this forecast and your current stock levels.
  2. Another step you can take to resolve this is to conduct a Product Modification to extinguish excess stock.

I still need help!

If you have any questions or would like to discuss anything further from what has been mentioned, please feel free to get in touch with us by clicking here.

economic value created

What is Economic Value Created (EVA)?

financial results for all firms

An increasingly popular way of measuring the financial performance of a firm is by looking at the Economic Value Created (often called EVA*) over a specified time span. See the Financial Reports section of the All Reports Menu for the firm’s current Economic Value Created report.

In essence, this measure views the business as an investment which must produce a certain return on the capital invested in it. If it produces more than the required return, then the difference is the economic value created or added (EVA).

The “actual return” is calculated by adjusting the net operating profit after tax to exclude the effects of interest.

The “required return” (or cost of capital) is calculated by adding together the interest charges on debt with the return required by the shareholders. The return required by the shareholders will vary according your firm’s level of risk and will be composed of required dividends and/or increases in share price.

If the actual return is higher than the cost of capital, then the difference is the economic value created. From an economic viewpoint this extra return must be due to some competitive advantage. The question is: How long can this competitive advantage be maintained before competitors come along and copy it?

An example of a simple EVA report is below:

EVA Report in MikesBikes

Notes:

*EVA is a registered Trademark of Stern, Stewart & Co.

different colored bikes

Question of the Week: Can we abandon a recently launched product?

If you accidentally launched a product and wish to abandon this in the same period, you can do so before the rollover.

To do this:

  1. Go to the Products menu. Then click on the Product that you wish to abandon.
  2. On the right-hand menu, click on the Abandon button.

You can launch this product again in a future rollover.

This video will demonstrate how you can abandon your product:

Do you have a question suggestion for our next Question of the Week? Click here to fill out a form or email it through to help@smartsims.com.

Factory to demonstrate Wastage in MikesBikes

Question of the Week: How do we decrease our factory’s Wastage?

Factory Capacity table and chart in MikesBikes

In MikesBikes Introduction, effective capacity will prove to be less than your plan capacity because of various Wastage factors such as:

  • Rework
  • Setup Time
  • Raw Materials Stockout
  • Machine Downtime

Wastage reduces your factory’s efficiency by using up time that could have been utilized to produce bikes. To improve or decrease Wastage, you will need to spend or economically increase your expenditure on Efficiency.

However, there are trade-offs on this. At a certain point, it can get more expensive to maintain a high factory Efficiency. So you will need to decide if it would be more economical to invest in expanding your factory (which can also be quite expensive and its value also depreciates over time) or you can choose to increase spending in Efficiency, which again gets costly at some point. The key is to find balance in between and see what works best with regards to what your firm is trying to achieve and what you believe to be a worthwhile investment.

As such, there is no “acceptable” percentage of wastage that you should be aiming for, as this is dependent on what your firm believes to be a more economical approach on balancing your factory’s efficiency.

Do you have a question suggestion for our next question of the week? Click here to fill out a form or email it through to help@smartsims.com.

Distribution in MikesBikes

Question of the Week: How do we get more stores to stock our products?

MikesBikes Distribution Decision

Distributors look at the total dollar amount of margin earned from stocking each firm’s products last year. Based on that, each Distribution Channel will decide how many stores will stock products from each firm.

The total amount of margin a Distributor receives is affected by your:

  • Retail Price
  • Retail Margin and;
  • Volume of Sales

So all other things being equal, if you sell more products, or increase your Retailer margin then more Distributors will be willing to stock your products and your distribution indexes will increase.

The number of each type of distributor willing to stock your products is then combined with the shopping habits of each segment to give a segment level distribution index. This is why you see different distribution indexes in the Market Summary / All Product Details report.

Have a Question of the Week suggestion? Send this to us here or message us on Facebook.